
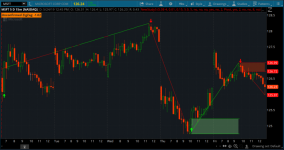
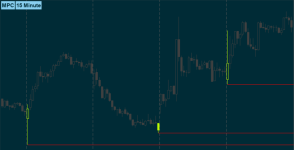
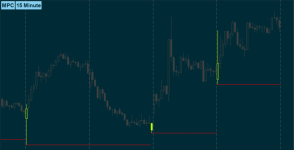
Here is the ZigZag High Low indicator with Supply and Demand Zones. In addition to that, we also have Fibonacci extension, alerts, reversal signals, and price change shown in bubbles style. You can adjust these features to your liking after adding the indicator.

thinkScript Code
Rich (BB code):
# Archive Name: ZigZag High Low with Supply DemandIndex and Fibs_Linus_Lar
# Archive Section: Scripts
# Suggested Tos Name: ZigZagHighLow_SupplyDemand_FibExtensions_LinusLar
# Archive Date:
# Archive Notes:

#TOS version ZigZagHighLow modified in part by Linus' and Lar's code
input bubbleoffset = .0005;
input percentamount = .01;
input revAmount = .15;
input atrreversal = 1.0;
input atrlength = 5;
def zz = ZigZagHighLow("price h" = high, "price l" = low, "percentage reversal" = percentAmount, "absolute reversal" = revAmount, "atr length" =atrlength, "atr reversal" = atrreversal);
def reversalAmount        = if (close * percentamount / 100) > Max(revAmount < atrreversal * atrlength, revAmount) then (close * percentamount / 100) else if revAmount < atrreversal * atrlength then atrreversal * atrlength else revAmount;
rec zzSave = if !IsNaN(zz) then zz else GetValue(zzSave, 1);
def chg = (if zzSave == high then high else low) - GetValue(zzSave, 1);
def isUp = chg >= 0;
rec isConf = AbsValue(chg) >= reversalAmount or (IsNaN(GetValue(zz, 1)) and GetValue(isConf, 1));
def zzd = if isUp then 1 else 0;
plot zzp = if zzd <= 1 then zz else Double.NaN;
zzp.AssignValueColor(if zzd == 1 then Color.GREEN else if zzd == 0 then Color.RED else Color.DARK_ORANGE);
zzp.SetStyle(Curve.FIRM);
zzp.EnableApproximation();

#Price Change between zigzags
def xxhigh = if zzSave == high then  high else xxhigh[1];
def chghigh = high - xxhigh[1];
def xxlow = if zzSave == low then low else xxlow[1];
def chglow = low - xxlow[1];
input showBubbleschange = yes;
AddChartBubble(showBubbleschange and !IsNaN(zz) and BarNumber() != 1, if isUp then high * (1 + bubbleoffset)  else low * (1 - bubbleoffset)   , "$" + chg , if isUp and chghigh > 0 then Color.GREEN else if isUp and chghigh < 0 then Color.RED else if isUp then Color.YELLOW else if !isUp and chglow > 0 then Color.GREEN else if !isUp and chglow < 0 then Color.RED else Color.YELLOW, isUp);

#Price at High/Low
input showBubblesprice = no;
AddChartBubble(showBubblesprice and !IsNaN(zz) and BarNumber() != 1, if isUp then high * (1 + bubbleoffset)  else low * (1 - bubbleoffset)   , if isUp then "$" + high else "$" + low , if isUp and chghigh > 0 then Color.GREEN else if isUp and chghigh < 0 then Color.RED else if isUp then Color.YELLOW else if !isUp and chglow > 0 then Color.GREEN else if !isUp and chglow < 0 then Color.RED else Color.YELLOW, isUp);

#Label for Confirmed/Unconfirmed Status of Current Zigzag
AddLabel(BarNumber() != 1, (if isConf then "Confirmed " else "Unconfirmed ") + "ZigZag: " + chg, if !isConf then Color.DARK_ORANGE else if isUp then Color.GREEN else Color.RED);

#Bar Count between zigzags
rec zzcount = if zzSave[1] != zzSave then 1 else if zzSave[1] == zzSave then zzcount[1] + 1 else 0;
def zzcounthilo   =  if zzcounthilo[1] == 0 and (zzSave == high or zzSave == low) then 1 else if zzSave == high or zzSave == low then zzcounthilo[1] + 1 else zzcounthilo[1];
def zzhilo = if zzSave == high or zzSave == low then zzcounthilo else zzcounthilo + 1;
def zzcounthigh = if zzSave == high then zzcount[1] else Double.NaN;
def zzcountlow =  if zzSave == low then zzcount[1] else Double.NaN;
input showBubblesbarcount = no;
AddChartBubble(showBubblesbarcount and !IsNaN(zz) and BarNumber() != 1, if isUp then high * (1 + bubbleoffset)  else low * (1 - bubbleoffset)  , if zzSave == high then zzcounthigh else zzcountlow, if isUp and chghigh > 0 then Color.GREEN else if isUp and chghigh < 0 then Color.RED else if isUp then Color.YELLOW else if !isUp and chglow > 0 then Color.GREEN else if !isUp and chglow < 0 then Color.RED else Color.YELLOW, if isUp then yes else no );

#Arrows
def zzL = if !IsNaN(zz) and !isUp then low else GetValue(zzL, 1);
def zzH = if !IsNaN(zz) and isUp then high else GetValue(zzH, 1);
def dir = CompoundValue(1, if zzL != zzL[1] or low==zzl[1] and low==zzsave then 1 else if zzH != zzH[1] or high==zzh[1] and high==zzsave then -1 else dir[1], 0);
def signal = CompoundValue(1, if dir > 0 and low > zzL then if signal[1] <= 0 then 1 else signal[1] else if dir < 0 and high < zzH then if signal[1] >= 0 then -1 else signal[1]    else signal[1], 0);
input showarrows = no;
plot U1 = showarrows and signal > 0 and signal[1] <= 0;
U1.SetPaintingStrategy(PaintingStrategy.BOOLEAN_ARROW_UP);
U1.SetDefaultColor(Color.GREEN);
U1.SetLineWeight(4);
plot D1 = showarrows and signal < 0 and signal[1] >= 0;
D1.SetPaintingStrategy(PaintingStrategy.BOOLEAN_ARROW_DOWN);
D1.SetDefaultColor(Color.RED);
D1.SetLineWeight(4);

#Alerts
input usealerts = no;
Alert(usealerts and U1, "ZIG-UP", Alert.BAR, Sound.Bell);
Alert(usealerts and D1, "ZAG-DOWN", Alert.BAR, Sound.Chimes);

#Supply Demand Areas
rec data1 = CompoundValue(1, if (zzSave == high or zzSave == low) then data1[1] + 1 else data1[1], 0);
def datacount1 = (HighestAll(data1) - data1[1]);
input numbersuppdemandtoshow = 2;
input showSupplyDemand = {default Pivot, Arrow, None};
def idx = if showSupplyDemand == showSupplyDemand.Pivot then 1 else 0;
def rLow;
def rHigh;
if signal crosses 0 {
    rLow = low[idx];
    rHigh = high[idx];
} else {
    rLow = rLow[1];
    rHigh = rHigh[1];
}
plot HighLine = if datacount1 <= numbersuppdemandtoshow and showSupplyDemand != showSupplyDemand.None and !isNaN(close) and rHigh != 0 then rHigh else Double.NaN;
HighLine.SetPaintingStrategy(PaintingStrategy.HORIZONTAL);
HighLine.AssignValueColor(if signal > 0 then Color.GREEN else Color.RED);

plot LowLine = if datacount1 <= numbersuppdemandtoshow and  showSupplyDemand != showSupplyDemand.None and !isNaN(close) and rLow != 0 then rLow else Double.NaN;
LowLine.SetPaintingStrategy(PaintingStrategy.HORIZONTAL);
LowLine.AssignValueColor(if signal > 0 then Color.GREEN else Color.RED);

def hlUp = if signal > 0 then HighLine else Double.NaN;
def hlDn = if signal < 0 then HighLine else Double.NaN;

input showsupplydemandcloud = yes;
AddCloud(if showsupplydemandcloud then hlUp else double.nan, LowLine, Color.LIGHT_GREEN, Color.LIGHT_GREEN);
AddCloud(if showsupplydemandcloud then hlDn else double.nan, LowLine, Color.LIGHT_RED, Color.LIGHT_RED);

#Store Previous Data
def zzsave1 = if !IsNaN(zzSave) then zzSave else zzsave1[1];
def zzsave2 = zzsave1;
rec priorzz1 = if zzsave2  != zzsave2[1]  then zzsave2[1]  else priorzz1[1];
rec priorzz2 = if priorzz1 != priorzz1[1] then priorzz1[1] else priorzz2[1];
rec priorzz3 = if priorzz2 != priorzz2[1] then priorzz2[1] else priorzz3[1];

#Fibonacci Extensions
rec data = CompoundValue(1, if (zzSave == high or zzSave == low) then data[1] + 1 else data[1], 0);
def datacount = (HighestAll(data) - data[1]);
input numberextfibstoshow = 2;
rec cpo = if dir[1] != dir then 0 else 1;
input showFibExtLines = yes;
input showtodayonly = no;
def today = if showtodayonly == yes then GetDay() == GetLastDay() else GetDay();
def extfib1 = if zzSave == high then high - AbsValue(priorzz2 - priorzz1) * 1
else extfib1[1];
plot extfib100 = if datacount <= numberextfibstoshow and today and showFibExtLines and !IsNaN(extfib1) and dir < 0 and cpo != 0 then extfib1[1] else Double.NaN;
extfib100.SetPaintingStrategy(PaintingStrategy.DASHES);
extfib100.SetDefaultColor(Color.RED);
extfib100.SetLineWeight(1);
extfib100.HideBubble();
def extfib1a = if zzSave == high then high - AbsValue(priorzz2 - priorzz1) * 0.382
else extfib1a[1];
plot extfib382 = if datacount <= numberextfibstoshow and today and showFibExtLines and !IsNaN(extfib1a) and dir < 0 and cpo != 0 then extfib1a[1] else Double.NaN;
extfib382.SetPaintingStrategy(PaintingStrategy.DASHES);
extfib382.SetDefaultColor(Color.RED);
extfib382.SetLineWeight(1);
extfib382.HideBubble();
def extfib2 = if zzSave == high then high - AbsValue(priorzz2 - priorzz1) *
0.618 else extfib2[1];
plot extfib618 = if datacount <= numberextfibstoshow and today and showFibExtLines and !IsNaN(extfib2) and dir < 0 and cpo != 0  then extfib2[1] else Double.NaN;
extfib618.SetPaintingStrategy(PaintingStrategy.DASHES);
extfib618.SetDefaultColor(Color.RED);
extfib618.SetLineWeight(1);
extfib618.HideBubble();
def extfib3 = if zzSave == high then high - AbsValue(priorzz2 - priorzz1) *
1.618 else extfib3[1];
plot extfib1618 = if datacount <= numberextfibstoshow and today and showFibExtLines and  !IsNaN(extfib3) and dir < 0  and cpo != 0  then extfib3[1] else Double.NaN;
extfib1618.SetPaintingStrategy(PaintingStrategy.DASHES);
extfib1618.SetDefaultColor(Color.RED);
extfib1618.SetLineWeight(1);
extfib1618.HideBubble();
def extfib3a = if zzSave == high then high - AbsValue(priorzz2 - priorzz1) *
2.000 else extfib3a[1];
plot extfib2000 = if datacount <= numberextfibstoshow and today and showFibExtLines and  !IsNaN(extfib3a) and dir < 0  and cpo != 0  then extfib3a[1] else Double.NaN;
extfib2000.SetPaintingStrategy(PaintingStrategy.DASHES);
extfib2000.SetDefaultColor(Color.RED);
extfib2000.SetLineWeight(1);
extfib2000.HideBubble();
def extfib4 = if zzSave == high then high - AbsValue(priorzz2 - priorzz1) *
2.618 else extfib4[1];
plot extfib2618 = if  datacount <= numberextfibstoshow and today and showFibExtLines and !IsNaN(extfib4) and dir < 0  and cpo != 0  then extfib4[1] else Double.NaN;
extfib2618.SetPaintingStrategy(PaintingStrategy.DASHES);
extfib2618.SetDefaultColor(Color.RED);
extfib2618.SetLineWeight(1);
extfib2618.HideBubble();
def extfib5 = if zzSave == high then high - AbsValue(priorzz2 - priorzz1) *
3.618 else extfib5[1];
plot extfib3618 = if  datacount <= numberextfibstoshow and today and showFibExtLines and !IsNaN(extfib5) and dir < 0  and cpo != 0  then extfib5[1] else Double.NaN;
extfib3618.SetPaintingStrategy(PaintingStrategy.DASHES);
extfib3618.SetDefaultColor(Color.RED);
extfib3618.SetLineWeight(1);
extfib3618.HideBubble();
def extfib1_ = if zzSave == low then low + AbsValue(priorzz2 - priorzz1) * 1
else extfib1_[1];
plot extfib100_ = if datacount <= numberextfibstoshow and today and showFibExtLines and !IsNaN(extfib1_) and dir > 0 and cpo != 0 then extfib1_[1] else Double.NaN;
extfib100_.SetPaintingStrategy(PaintingStrategy.DASHES);
extfib100_.SetDefaultColor(Color.GREEN);
extfib100_.SetLineWeight(1);
extfib100_.HideBubble();
def extfib1a_ = if zzSave == low then low + AbsValue(priorzz2 - priorzz1) * 0.382
else extfib1a_[1];
plot extfib382_ = if datacount <= numberextfibstoshow and today and showFibExtLines and !IsNaN(extfib1a_) and dir > 0 and cpo != 0 then extfib1a_[1] else Double.NaN;
extfib382_.SetPaintingStrategy(PaintingStrategy.DASHES);
extfib382_.SetDefaultColor(Color.GREEN);
extfib382_.SetLineWeight(1);
extfib382_.HideBubble();
def extfib2_ = if zzSave == low then low + AbsValue(priorzz2 - priorzz1) *
0.618 else extfib2_[1];
plot extfib618_ = if datacount <= numberextfibstoshow and today and showFibExtLines and !IsNaN(extfib2_) and dir > 0  and cpo != 0  then extfib2_[1] else Double.NaN;
extfib618_.SetPaintingStrategy(PaintingStrategy.DASHES);
extfib618_.SetDefaultColor(Color.GREEN);
extfib618_.SetLineWeight(1);
extfib618_.HideBubble();
def extfib3_ = if zzSave == low then low + AbsValue(priorzz2 - priorzz1) *
1.618 else extfib3_[1];
plot extfib1618_ = if datacount <= numberextfibstoshow and today and showFibExtLines and !IsNaN(extfib3_) and dir > 0  and cpo != 0  then extfib3_[1] else Double.NaN;
extfib1618_.SetPaintingStrategy(PaintingStrategy.DASHES);
extfib1618_.SetDefaultColor(Color.GREEN);
extfib1618_.SetLineWeight(1);
extfib1618_.HideBubble();
def extfib3a_ = if zzSave == low then low + AbsValue(priorzz2 - priorzz1) *
2.000 else extfib3a_[1];
plot extfib2000_ = if datacount <= numberextfibstoshow and today and showFibExtLines and !IsNaN(extfib3a_) and dir > 0  and cpo != 0  then extfib3a_[1] else Double.NaN;
extfib2000_.SetPaintingStrategy(PaintingStrategy.DASHES);
extfib2000_.SetDefaultColor(Color.GREEN);
extfib2000_.SetLineWeight(1);
extfib2000_.HideBubble();
def extfib4_ = if zzSave == low then low + AbsValue(priorzz2 - priorzz1) *
2.618 else extfib4_[1];
plot extfib2618_ = if datacount <= numberextfibstoshow and today and showFibExtLines and !IsNaN(extfib4_) and dir > 0  and cpo != 0  then extfib4_[1]  else Double.NaN;
extfib2618_.SetPaintingStrategy(PaintingStrategy.DASHES);
extfib2618_.SetDefaultColor(Color.GREEN);
extfib2618_.SetLineWeight(1);
extfib2618_.HideBubble();
def extfib5_ = if zzSave == low then low + AbsValue(priorzz2 - priorzz1) *
3.618 else extfib5_[1];
plot extfib3618_ = if datacount <= numberextfibstoshow and today and showFibExtLines and !IsNaN(extfib5_) and dir > 0  and cpo != 0  then extfib5_[1]  else Double.NaN;
extfib3618_.SetPaintingStrategy(PaintingStrategy.DASHES);
extfib3618_.SetDefaultColor(Color.GREEN);
extfib3618_.SetLineWeight(1);
extfib3618_.HideBubble();
input fibextbubblespacesinexpansion = 8;
def b = fibextbubblespacesinexpansion;
def direction = if !isUp then 1 else 0;
AddChartBubble( direction[b + 1] == 1 and showFibExtLines and !IsNaN(close[b + 1]) and IsNaN(close), extfib1[b + 2], "100%", Color.RED, no);
AddChartBubble( direction[b + 1] == 1 and showFibExtLines and !IsNaN(close[b + 1]) and IsNaN(close), extfib1a[b + 2], "38.2%", Color.RED, no);
AddChartBubble( direction[b + 1] == 1 and showFibExtLines and !IsNaN(close[b + 1]) and IsNaN(close), extfib2[b + 2], "61.8%", Color.RED, no);
AddChartBubble( direction[b + 1] == 1 and showFibExtLines and !IsNaN(close[b + 1]) and IsNaN(close), extfib3[b + 2], "161.8%", Color.RED, no);
AddChartBubble( direction[b + 1] == 1 and showFibExtLines and !IsNaN(close[b + 1]) and IsNaN(close), extfib3a[b + 2], "200%", Color.RED, no);
AddChartBubble( direction[b + 1] == 1 and showFibExtLines and !IsNaN(close[b + 1]) and IsNaN(close), extfib4[b + 2], "261.8%", Color.RED, no);
AddChartBubble( direction[b + 1] == 1 and showFibExtLines and !IsNaN(close[b + 1]) and IsNaN(close), extfib5[b + 2], "361.8%", Color.RED, no);
AddChartBubble( direction[b + 1] == 0 and showFibExtLines and !IsNaN(close[b + 1]) and IsNaN(close), extfib1_[b + 2], "100%", Color.GREEN, yes);
AddChartBubble( direction[b + 1] == 0 and showFibExtLines and !IsNaN(close[b + 1]) and IsNaN(close), extfib1a_[b + 2], "38.2%", Color.GREEN, yes);
AddChartBubble( direction[b + 1] == 0 and showFibExtLines and !IsNaN(close[b + 1]) and IsNaN(close), extfib2_[b + 2], "61.8%", Color.GREEN, yes);
AddChartBubble( direction[b + 1] == 0 and showFibExtLines and !IsNaN(close[b + 1]) and IsNaN(close), extfib3_[b + 2], "161.8%", Color.GREEN, yes);
AddChartBubble( direction[b + 1] == 0 and showFibExtLines and !IsNaN(close[b + 1]) and IsNaN(close), extfib3a_[b + 2], "200%", Color.GREEN, yes);
AddChartBubble( direction[b + 1] == 0 and showFibExtLines and !IsNaN(close[b + 1]) and IsNaN(close), extfib4_[b + 2], "261.8%", Color.GREEN, yes);
AddChartBubble( direction[b + 1] == 0 and showFibExtLines and !IsNaN(close[b + 1]) and IsNaN(close), extfib5_[b + 2], "361.8%", Color.GREEN, yes);

#Volume at Reversals
def vol = if BarNumber() == 0 then 0 else volume + vol[1];
def vol1 = if BarNumber() == 1 then volume else vol1[1];
def xxvol = if zzSave == high or zzSave == low then TotalSum(volume) else xxvol[1];
def chgvol =  if xxvol - xxvol[1] + vol1 == vol then vol else xxvol - xxvol[1];
input showBubblesVolume = no;
AddChartBubble(showBubblesVolume and !IsNaN(zz) and BarNumber() != 1, if isUp then high * (1 + bubbleoffset)  else low * (1 - bubbleoffset), chgvol,if isUp and chghigh > 0 then Color.GREEN else if isUp and chghigh < 0 then Color.RED else if isUp then Color.YELLOW else if !isUp and chglow > 0 then Color.GREEN else if !isUp and chglow < 0 then Color.RED else Color.YELLOW, if isUp then yes else no );
Shareable Link
https://tos.mx/ZbuQDXAttachments
Last edited:
") I guess I'll check back...
I guess I'll check back...