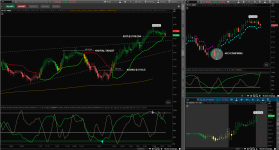
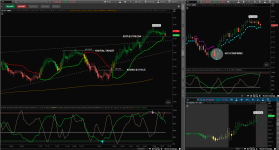
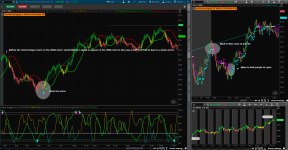
can you kindly share this gird please?LETS GO

You are using an out of date browser. It may not display this or other websites correctly.
You should upgrade or use an alternative browser.
You should upgrade or use an alternative browser.
/ES Futures Trading Strategy on ThinkorSwim
- Thread starter blakecmathis
- Start date
- Status
- Not open for further replies.

New Indicator: Buy the Dip
Check out our Buy the Dip indicator and see how it can help you find profitable swing trading ideas. Scanner, watchlist columns, and add-ons are included.
blakecmathis
Well-known member
Thank you very much. Appreciate it!
Quick Question ? is this is super trend that you are using?LETS GO

Attachments
blakecmathis
Well-known member
@ajsimon_us Negative.
Quick Question ? is this is super trend that you are using?
@ajsimon_us By "SUPER TREND" in your reference to @blakecmathis shared grid above, I presume you're referring to the candle colors?
If so, here's the statement that does it for you
AssignPriceColor(if Colorbars ==1 then colorbars.color("buy_signal_bars") else if colorbars ==2 then colorbars.color("Sell_Signal_bars") else colorbars.color("neutral"));
As @blakecmathis pointed out it definitely is not a "Super Trend" indicator at work!
Have a great evening ahead
Thank you @ tomsk and @blakecmathis. i was wondering the what is the line that change its color dynamically@ajsimon_us By "SUPER TREND" in your reference to @blakecmathis shared grid above, I presume you're referring to the candle colors?
If so, here's the statement that does it for you
AssignPriceColor(if Colorbars ==1 then colorbars.color("buy_signal_bars") else if colorbars ==2 then colorbars.color("Sell_Signal_bars") else colorbars.color("neutral"));
As @blakecmathis pointed out it definitely is not a "Super Trend" indicator at work!
Have a great evening ahead
Thank you @ tomsk and @blakecmathis. i was wondering the what is the line that change its color dynamically
BTW you can only have one AssignPriceColor() statement in your study, so you can lump in as many conditions as you wish within that one statement. The way that it's implemented in @blakecmathis code is the usual way but I have seen far more complicated conditional statements being used in other studies!
Thank you!BTW you can only have one AssignPriceColor() statement in your study, so you can lump in as many conditions as you wish within that one statement. The way that it's implemented in @blakecmathis code is the usual way but I have seen far more complicated conditional statements being used in other studies!
blakecmathis
Well-known member
blakecmathis
Well-known member
"Chinese state media Xinhua reported Sunday that the two sides had "constructive talks" on trade in a high-level phone call on Saturday but gave no further details on the timing of a possible deal." Considering China has been the contrarian during this whole process, I think this is a really good sign that a trade deal is coming. Might be a volatile week trading ES!!
@tomsk I couldn't write the code for a single vertical line on a chart if my life depended on it. These are all written from the great dudes on this site such as yourself!! I just know how to delete specific lines of code to capture what I'm chasing: simplicity.
@blakecmathis Sure you can, just take it apart one piece at a time. Since you mentioned vertical line, here's a real simple way to draw a vertical line at the 09:30 RTH open, on an intraday chart of course!
declare hide_on_daily;
input start = 0930;
AddVerticalLine(SecondsFromTime(start) == 0 and secondsTillTime(start) == 0, "RTH OPEN 9:30 AM ", Color.Cyan, Curve.Short_Dash);
blakecmathis
Well-known member
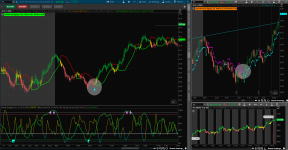
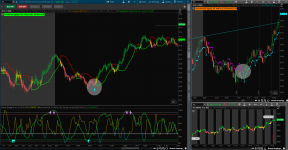
@tomsk Would it be possible to implement a buy/sell signal on the 1000t chart based on a CCI trend change on the 2000t chart? I drew that buy signal in that I highlighted just to provide an example

@blakecmathis I suppose anything is possible provided you accurately define what CCI trend change means. I'm not really sure what studies have been loaded in your chart above - it sure does not have any indication of any CCI studies in there. Personally I use time charts but I suppose by extension the concept can be carried forth to tick charts.
Attachments
blakecmathis
Well-known member
blakecmathis
Well-known member
blakecmathis
Well-known member
This is the CCI indicator. I believe it is a combination of CCI and some other study.
https://tos.mx/dDZh6eC
https://tos.mx/dDZh6eC
@tomsk Buy Signal = change from purple to cyan. Sell Signal = change from cyan to purple.
It appears you are referring to the lower study that is generating those purple/cyan arrows.
Sure does not seem to have any CCI component there.
Like I mentioned earlier I'm not really sure what studies have been loaded in your chart above
So long as the arrows have been identified, all you need is an Alert() statement and you're done
Not clear what you're looking for
blakecmathis
Well-known member
blakecmathis
Well-known member
Attachments
- Status
- Not open for further replies.
Join useThinkScript to post your question to a community of 21,000+ developers and traders.
Similar threads
-
/ES Futures, /GC, and even FX Trading strategy For ThinkOrSwim
- Started by tradebyday
- Replies: 38
-
-
Futures strategy: Wide Ranging Days In ThinkOrSwim
- Started by danB
- Replies: 33
-
-
Verniman strategy for /ES Futures Entry signals For ThinkOrSwim
- Started by STB
- Replies: 41
Not the exact question you're looking for?
Start a new thread and receive assistance from our community.
87k+
Posts
1039
Online
Similar threads
-
/ES Futures, /GC, and even FX Trading strategy For ThinkOrSwim
- Started by tradebyday
- Replies: 38
-
-
Futures strategy: Wide Ranging Days In ThinkOrSwim
- Started by danB
- Replies: 33
-
-
Verniman strategy for /ES Futures Entry signals For ThinkOrSwim
- Started by STB
- Replies: 41
The Market Trading Game Changer
Join 2,500+ subscribers inside the useThinkScript VIP Membership Club
- Exclusive indicators
- Proven strategies & setups
- Private Discord community
- ‘Buy The Dip’ signal alerts
- Exclusive members-only content
- Add-ons and resources
- 1 full year of unlimited support
Frequently Asked Questions
What is useThinkScript?
useThinkScript is the #1 community of stock market investors using indicators and other tools to power their trading strategies. Traders of all skill levels use our forums to learn about scripting and indicators, help each other, and discover new ways to gain an edge in the markets.
How do I get started?
We get it. Our forum can be intimidating, if not overwhelming. With thousands of topics, tens of thousands of posts, our community has created an incredibly deep knowledge base for stock traders. No one can ever exhaust every resource provided on our site.
If you are new, or just looking for guidance, here are some helpful links to get you started.
- The most viewed thread:
https://usethinkscript.com/threads/repainting-trend-reversal-for-thinkorswim.183/ - Our most popular indicator:
https://usethinkscript.com/threads/buy-the-dip-indicator-for-thinkorswim.3553/ - Answers to frequently asked questions:
https://usethinkscript.com/threads/answers-to-commonly-asked-questions.6006/
What are the benefits of VIP Membership?
VIP members get exclusive access to these proven and tested premium indicators: Buy the Dip, Advanced Market Moves 2.0, Take Profit, and Volatility Trading Range. In addition, VIP members get access to over 50 VIP-only custom indicators, add-ons, and strategies, private VIP-only forums, private Discord channel to discuss trades and strategies in real-time, customer support, trade alerts, and much more. Learn all about VIP membership here.
How can I access the premium indicators?
To access the premium indicators, which are plug and play ready, sign up for VIP membership here.

