Equal Highs and Equal Lows For ThinkOrSwim

Focus

Member
can anyone convert this code to TOS?
https://www.tradingview.com/script/wSr22FsQ-Equal-Highs-and-Equal-Lows/

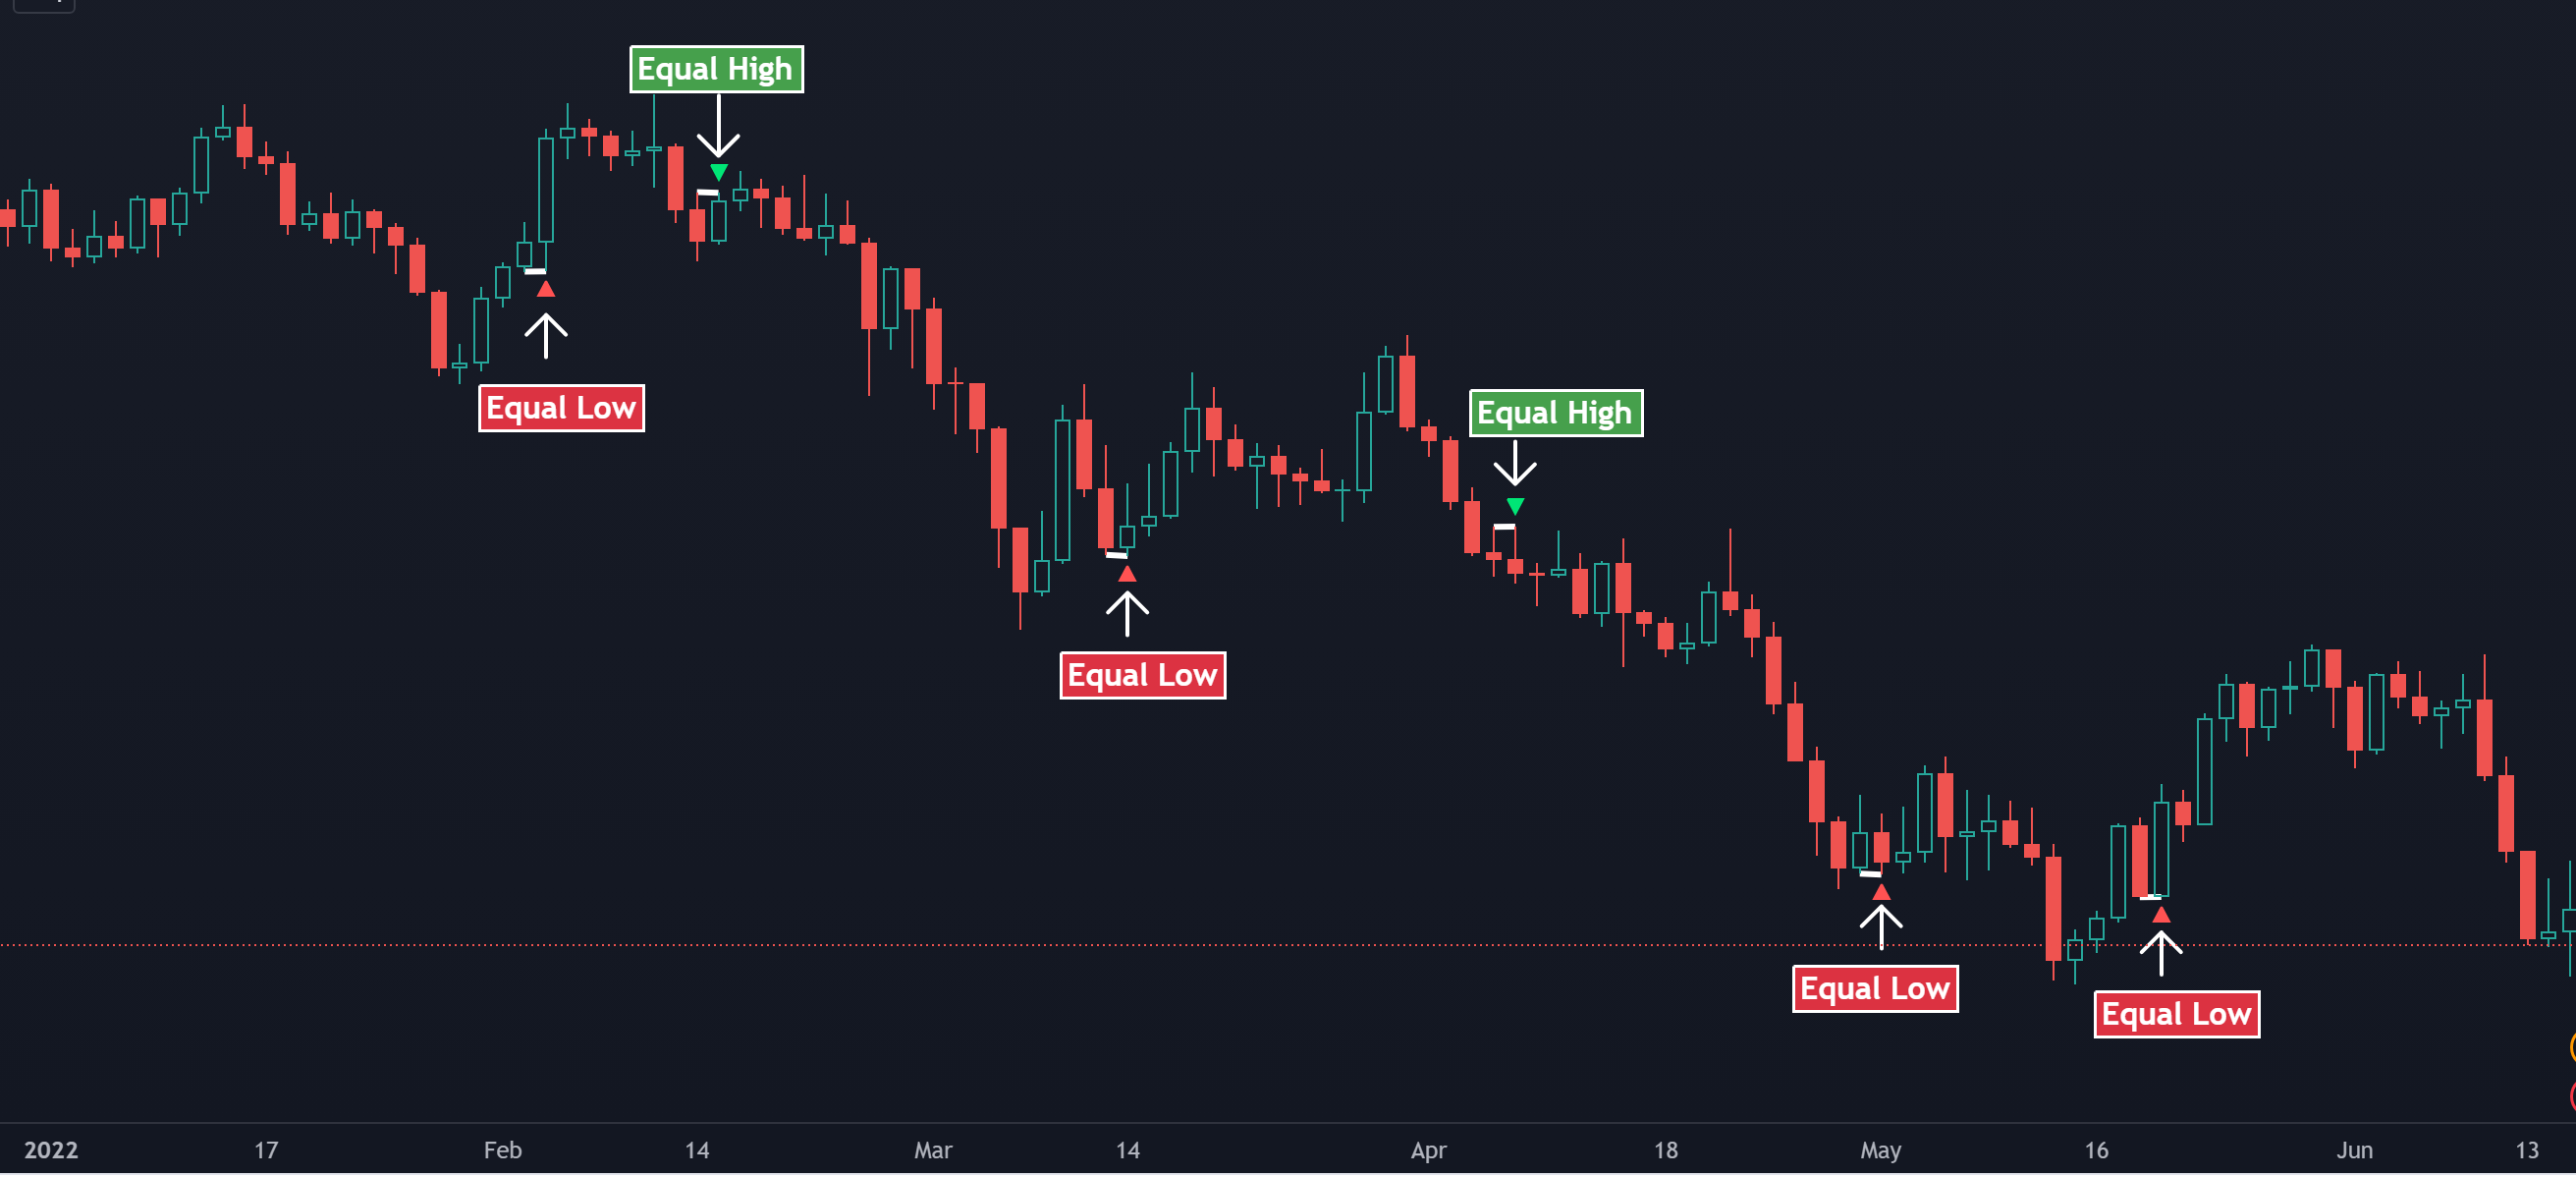
This indicator looks for two consecutive candles where the highs or lows are at the same level.
This alignment suggests a slowdown in momentum and/or potential exhaustion of the current trend.

The equal highs/lows can be useful in detecting potential changes in trend direction.
It's a sign that the current trend might be losing steam or reversing,

When this pattern occurs within an established trend, these equal highs/lows can indicate potential areas for pullbacks or corrections before the trend continues.

Usage
Use the pattern to find reversals.
Use the pattern to find pullbacks.
8F531IB.png
 
Last edited by a moderator:
@samer800 @halcyonguy and anyone who is a good coder convert this code to TOS? The indicator only detects two candles EQL and EQH. I'd like it to look for more than two candles with EQL and EQH.
https://www.tradingview.com/script/wSr22FsQ-Equal-Highs-and-Equal-Lows/


// This work is licensed under a Attribution-NonCommercial-ShareAlike 4.0 International (CC BY-NC-SA 4.0) https://creativecommons.org/licenses/by-nc-sa/4.0/
// © ProValueTrader
//@version=5
indicator("Equal Highs and Equal Lows", shorttitle="Equal Highs/Lows", overlay=true, max_lines_count=500)
//////////////////////////////////////////////////////////////////////////////// Equal Highs/Lows
precision = input.int(2, step= 1, minval= 1, tooltip="A low value returns more exact Equal Highs/Lows. The value 1 returns the most accurate Equal Highs/Lows")
PlotLines = input.bool(true, title="Plot Lines",inline="Line")
LineCol = input(color.new(color.white,0),title="Line Color",inline="Line")
LineWidth = input.int(3, step= 1, minval= 0,title="Line Width",inline="Line")
PlotShapes = input.bool(true, title="Plot Shapes",inline="Shape")
ShapeCol_Highs = input(color.new(color.lime,0),title="Highs Color",inline="Shape")
ShapeCol_Lows = input(color.new(color.red,0),title="Lows Color",inline="Shape")

// max/min
max = math.max(high,high[1])
min = math.min(low,low[1])
// Normalize
top = (math.abs(high - high[1])/(max-min))*100
bottom = (math.abs(low - low[1])/(max-min))*100
//Condition
top_v = ta.crossunder(top,precision)
bottom_v = ta.crossunder(bottom,precision)
//Lines
var line [] Top = array.new_line()
var line [] Bot = array.new_line()
if top_v and PlotLines
t = line.new(bar_index[1],high[1],bar_index,high, color=LineCol, style=line.style_solid, width=LineWidth)
array.push(Top,t)
if bottom_v and PlotLines
b = line.new(bar_index[1],low[1],bar_index,low, color=LineCol, style=line.style_solid, width=LineWidth)
array.push(Bot,b)
//Plot
plotshape(PlotShapes?top_v:na, color=ShapeCol_Highs, offset=0, style=shape.triangledown, size=size.tiny, location=location.abovebar, title="Equal Highs")
plotshape(PlotShapes?bottom_v:na, color=ShapeCol_Lows, offset=0, style=shape.triangleup, size=size.tiny, location=location.belowbar, title="Equal Lows")
licence = input.string("Licence", group="This work is licensed under a Attribution-NonCommercial-ShareAlike 4.0 International (CC BY-NC-SA 4.0) https://creativecommons.org/licenses/by-nc-sa/4.0/",tooltip="This work is licensed under a Attribution-NonCommercial-ShareAlike 4.0 International (CC BY-NC-SA 4.0) https://creativecommons.org/licenses/by-nc-sa/4.0/")
check the below

CSS:
#/ This work is licensed under a Attribution-NonCommercial-ShareAlike 4.0 International (CC BY-NC-SA
#// © ProValueTrader
#indicator("Equal Highs and Equal Lows", shorttitle="Equal Highs/Lows", overlay=true, max_lines_count=500)
# Converted and mod by Sam4Cok@Samer800    - 12/2023 - Request from UseThinkScript.com member

input timeframe = {default "Chart", "Custom"};
input customTimeframe = AggregationPeriod.FIFTEEN_MIN;
input precision = 2;        # "A low value returns more exact Equal Highs/Lows.
input PlotLines = yes;      # "Plot Lines"
input PlotShapes = yes;     # "Plot Shapes"

def na = Double.NaN;

def hTF = high;
def lTF = low;
def hHTF = high(Period = customTimeframe);
def lHTF = low(Period = customTimeframe);

def h;
def l;
switch (timeframe) {
case "Custom" :
    h    = hHTF;
    l    = lHTF;
default :
    h    = hTF;
    l    = lTF;
}

#// max/min
def max = max(h,h[1]);
def min = min(l,l[1]);
#// Normalize
def top = (AbsValue(h - h[1])/(max-min))*100;
def bottom = (AbsValue(l - l[1])/(max-min))*100;
#//Condition
def top_v = (top Crosses Below precision);
def bot_v = (bottom Crosses Below precision);
def tPre = if top_v[-1] then h else tPre[1];
def bPre = if bot_v[-1] then l else bPre[1];
def t = if (top_v[-1] or top_v) and PlotLines then tPre else na;
def b = if (bot_v[-1] or bot_v) and PlotLines then bPre else na;

plot hiLine = t;
plot loLine = b;
plot EqualHighs = if PlotShapes then if !top_v[-1] and top_v then high else na else na;
plot EqualLows = if PlotShapes then if !bot_v[-1] and bot_v then low else na else na;

EqualHighs.SetPaintingStrategy(PaintingStrategy.BOOLEAN_WEDGE_UP);
EqualLows.SetPaintingStrategy(PaintingStrategy.BOOLEAN_WEDGE_DOWN);
EqualHighs.SetDefaultColor(Color.GREEN);
EqualLows.SetDefaultColor(Color.RED);
hiLine.SetDefaultColor(Color.CYAN);
loLine.SetDefaultColor(Color.MAGENTA);
hiLine.SetLineWeight(2);
loLine.SetLineWeight(2);

#-- END of CODE
 

Join useThinkScript to post your question to a community of 21,000+ developers and traders.

Similar threads

Not the exact question you're looking for?

Start a new thread and receive assistance from our community.

87k+ Posts
409 Online
Create Post

Similar threads

Similar threads

The Market Trading Game Changer

Join 2,500+ subscribers inside the useThinkScript VIP Membership Club
  • Exclusive indicators
  • Proven strategies & setups
  • Private Discord community
  • ‘Buy The Dip’ signal alerts
  • Exclusive members-only content
  • Add-ons and resources
  • 1 full year of unlimited support

Frequently Asked Questions

What is useThinkScript?

useThinkScript is the #1 community of stock market investors using indicators and other tools to power their trading strategies. Traders of all skill levels use our forums to learn about scripting and indicators, help each other, and discover new ways to gain an edge in the markets.

How do I get started?

We get it. Our forum can be intimidating, if not overwhelming. With thousands of topics, tens of thousands of posts, our community has created an incredibly deep knowledge base for stock traders. No one can ever exhaust every resource provided on our site.

If you are new, or just looking for guidance, here are some helpful links to get you started.

What are the benefits of VIP Membership?
VIP members get exclusive access to these proven and tested premium indicators: Buy the Dip, Advanced Market Moves 2.0, Take Profit, and Volatility Trading Range. In addition, VIP members get access to over 50 VIP-only custom indicators, add-ons, and strategies, private VIP-only forums, private Discord channel to discuss trades and strategies in real-time, customer support, trade alerts, and much more. Learn all about VIP membership here.
How can I access the premium indicators?
To access the premium indicators, which are plug and play ready, sign up for VIP membership here.
Back
Top