OicoforPenn
New member
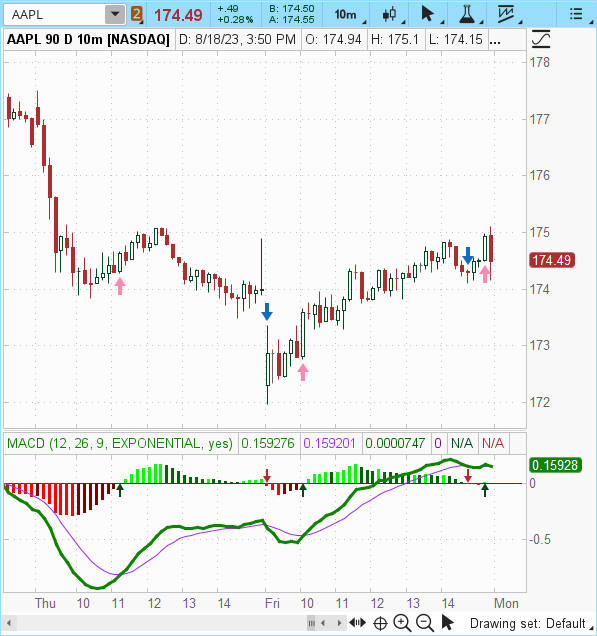
hey any help would be appreciated , trying to get a 2 custom studies to plot arrows over price chart
1. Price close is less than the 200 exponential moving average
MACDHistogramCrossover(exponential) is less then MACD(exponential) zeroline
ADX exponential is equal to or greater than 20
2.Price close is greater than the 200 exponential moving average
MACDHistogramCrossover(exponential) is greater then MACD(exponential) zeroline
ADX exponential is equal to or greater than 20
pretty sure both conditions can go on one study but i'm lost.
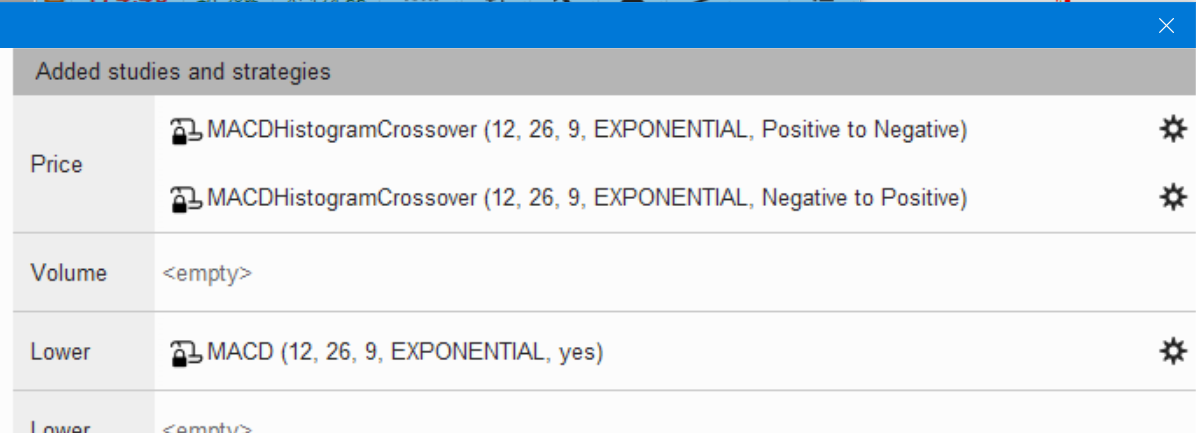
pretty sure can edit the MACDStrat from strategies i'm just not sure how to do it
1. Price close is less than the 200 exponential moving average
MACDHistogramCrossover(exponential) is less then MACD(exponential) zeroline
ADX exponential is equal to or greater than 20
2.Price close is greater than the 200 exponential moving average
MACDHistogramCrossover(exponential) is greater then MACD(exponential) zeroline
ADX exponential is equal to or greater than 20
pretty sure both conditions can go on one study but i'm lost.
pretty sure can edit the MACDStrat from strategies i'm just not sure how to do it