efficient code execution?

Glefdar

Active member
Question about efficient code execution "under the hood" - is data still calculated in variable definitions even if that data is never plotted?

I'm working on a script that plots SPX contract volumes at specific strikes. The strikes are represented by horizontal lines at those price levels on the chart. The volumes are represented by colors surrounding those horizontal line plots.

The study by default will show 0dte volumes of all these strikes for each bar on the chart. However, instead of using highestall to make the levels extend back through the entire chart time span,I have written the line plot code that marks the strike levels on the chart to only extend back for 1990 bars. I did this to conserve processing power.

However, it's not clear to me how much that is helping, thus my question:

If I have a bunch of variables called "def calculate_contract_volume_strike_1 = ..." etc. and they pull out the volumes for a bunch of different strikes from the SPX options chain, is that heavy lifting being done for every bar on the entire chart (which would be over ten thousand bars on a 1min 30 day chart); or do those variable definitions only execute the process of pulling the volumes from the strikes where"plot contract_volume_strike_1 = ..." etc. are painting something?

If the former case is true, instead of the latter, then it means that setting the strike levels to only paint back 1990 bars is only helping the script run faster by saving the power of painting more, but that still does NOT avoid the waste of calculating the strike volumes for the thousands of bars that are more than 1990 bars back.

If I want to make the script efficient, is it therefore necessary to not merely stop the strike line plots from appearing more than X bars back, but also to write each of the variable definitions in a way that checks if the current bar is more than X days back from the last close bar and returns double.nan if it's not recent enough instead of accessing the options chain volumes?

Basically I want the amount of processing power and bandwidth the script uses to be nearly the same whether my chart span is set to two days or thirty days. But it's not clear if stopping the plots from appearing more than two days back actually accomplishes that. Many thanks if anyone who understands the underlying guts of how thinkscript works can help clear this up for me.
 
Last edited by a moderator:
Question about efficient code execution "under the hood" - is data still calculated in variable definitions even if that data is never plotted?

I'm working on a script that plots SPX contract volumes at specific strikes. The strikes are represented by horizontal lines at those price levels on the chart. The volumes are represented by colors surrounding those horizontal line plots.

The study by default will show 0dte volumes of all these strikes for each bar on the chart. However, instead of using highestall to make the levels extend back through the entire chart time span,I have written the line plot code that marks the strike levels on the chart to only extend back for 1990 bars. I did this to conserve processing power.

However, it's not clear to me how much that is helping, thus my question:

If I have a bunch of variables called "def calculate_contract_volume_strike_1 = ..." etc. and they pull out the volumes for a bunch of different strikes from the SPX options chain, is that heavy lifting being done for every bar on the entire chart (which would be over ten thousand bars on a 1min 30 day chart); or do those variable definitions only execute the process of pulling the volumes from the strikes where"plot contract_volume_strike_1 = ..." etc. are painting something?

If the former case is true, instead of the latter, then it means that setting the strike levels to only paint back 1990 bars is only helping the script run faster by saving the power of painting more, but that still does NOT avoid the waste of calculating the strike volumes for the thousands of bars that are more than 1990 bars back.

If I want to make the script efficient, is it therefore necessary to not merely stop the strike line plots from appearing more than X bars back, but also to write each of the variable definitions in a way that checks if the current bar is more than X days back from the last close bar and returns double.nan if it's not recent enough instead of accessing the options chain volumes?

Basically I want the amount of processing power and bandwidth the script uses to be nearly the same whether my chart span is set to two days or thirty days. But it's not clear if stopping the plots from appearing more than two days back actually accomplishes that. Many thanks if anyone who understands the underlying guts of how thinkscript works can help clear this up for me.

as i understand it, every formula in a study is processed , evaluated, on every bar.

are you basing your study off of this one?
https://usethinkscript.com/threads/option-heatmap-and-oi-strikes-for-thinkorswim.10664/
Option Heatmap and OI Strikes For ThinkOrSwim


sorry, i am confused by this,
"The volumes are represented by colors surrounding those horizontal line plots."
'colors' isn't a shape that be drawn.
what are you drawing to represent volume?
if drawing this on a price chart, how are you scaling the volume numbers?

how are you calculating the strikes? from a constant, then add and subtract another constant?


to only evaluate a formula in the last few bars, it needs to find the last bar, to have a reference for counting back, so have to use highestall().

hmmm, or use,
def bars = 1990;
def x = (isnan(close[-bars]))
plot z = if x then 100 else na;


if the exact quantity of bars isn't important, then could use this, and avoid highestall().
[ getday() is based on a normal day 9:30 to 4pm. by not exact quantity, i meant what you see if you load a 23hour traded symbol. i should have said it differently. ]

def d = getday();
def na = double.nan;
def days = 2;
def x = ((d + days) >= getlastday());
plot z = if x then 100 else na;

and that could be restructured so both sides of if then don't have to be evaluated. put the section that will be true most of the time, first.
plot z = if !x then na else 100;


try to minimize the use of formulas that read data outside of the study.
if you use high 10 times, read it once and assign it to a variable.
def h = high.
then use h in formulas.


if i am going to have many (10+) variables with similar data, i make the names short.
instead of,
def calculate_contract_volume_strike_1 = ...
i would use,
def v_strike_1 = ...
and actually, i probably would add a comment to describe the name, and use,
def vs01 = ...
def vs02 = ...
 
Last edited:
as i understand it, every formula in a study is processed , evaluated, on every bar.

if the exact quantity of bars isn't important, then could use this, and avoid highestall().
def d = getday();
def na = double.nan;
def days = 2;
def x = ((d + days) >= getlastday());
plot z = if x then 100 else na;

and that could be restructured so both sides of if then don't have to be evaluated. put the section that will be true most of the time, first.
plot z = if !x then na else 100;


try to minimize the use of formulas that read data outside of the study.
if you use high 10 times, read it once and assign it to a variable.
def h = high.
then use h in formulas.

This is the advice I needed, thanks. The study isn't based on that script but a different one that I acquired. I have the plots working (to answer your question, the heatmap effect is created by using thick lines (with weight = 5) around the price level line at the strike on the chart - one thick line above for call volumes, and one thick line below for put volumes - and the thick lines are color coded in a gradient which goes from dim to bright shades based on what defined threshold range the volume at that strike was, as a percentage of the total contract volumes across all the strikes being measured by the study).

The strikes are determined as a rounded offset from the current close price (so it's plotting +/- 50 points from the rounded strike level of the current close in intervals of 5 points). I have it plotting correctly during the weekend but the fact that the current close price anchors the offset that is used to choose the strike levels makes me unsure if the frequency of repainting will make the script impractical during real trading hours. Maybe it will lag too much. So I was also thinking about maybe using the session open price as the anchor and then having some way to adjust that anchor every 20 points of movement that occurs, not sure yet. Still figuring that out.

I think the way you suggested using GetDay() is a great idea and I'll try using that to make it more efficient.
 
if the exact quantity of bars isn't important, then could use this, and avoid highestall().
def d = getday();
def na = double.nan;
def days = 2;
def x = ((d + days) >= getlastday());
plot z = if x then 100 else na;

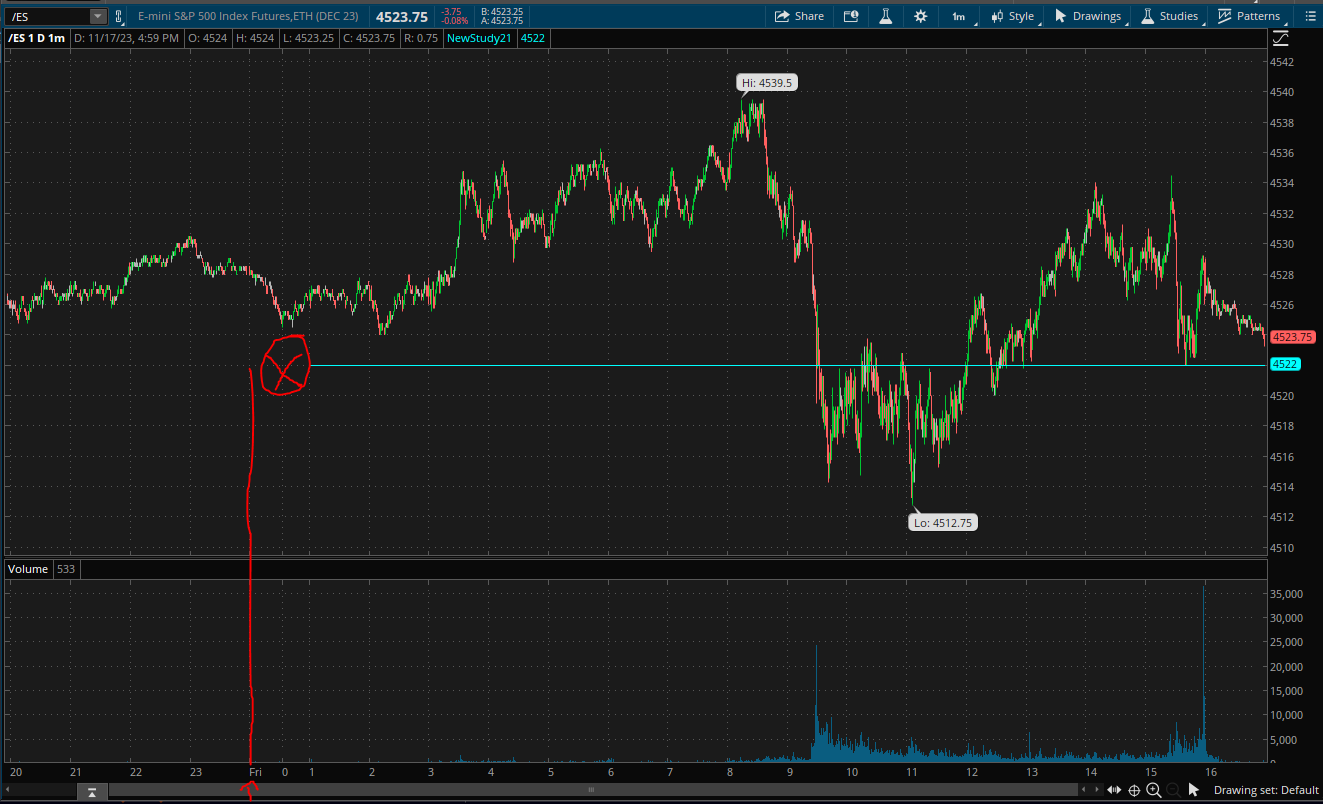
There seems to be a minor issue with this method, which shows on an /ES chart with this test code:

Code:
def d = getday();
def na = double.nan;
def days = 0;
def x = ((d + days) >= getlastday());

plot testplot1 = if !x then double.nan else 4522;

YSJkjnY.png


For some reason, the first hour after midnight is not recognized as belonging to the current day.

Since the immediate open often includes important clues about the coming session, I really want to capture what is happening in that first hour, but I don't want to set the "days" variable to include processing data for an entire additional day for that. But I can't find a solution or workaround. Might you have any idea about what would be an efficient way to capture that first hour without having to define the data capture window using a count back of bars (which in my testing seems to be slower/laggier than using GetDay and GetLastDay)?

EDIT: Interestingly, the test code using GetDay() does not have this problem of a gap now for the time since the Sunday futures open at 6pm, so it appears to only be a problem for the first hour after midnight (not the first hour recorded on the chart for the day).

EDIT 2: I realized (duh) the solution is actually very easy. I just need to add an offset for the bars of the first hour after midnight and then it correctly extends back to that point, (e.g. x_offset = 60, and use the code "if !x[-x_offset] then double.nan").
 
Last edited:
There seems to be a minor issue with this method, which shows on an /ES chart with this test code:

Code:
def d = getday();
def na = double.nan;
def days = 0;
def x = ((d + days) >= getlastday());

plot testplot1 = if !x then double.nan else 4522;

YSJkjnY.png


For some reason, the first hour after midnight is not recognized as belonging to the current day.

Since the immediate open often includes important clues about the coming session, I really want to capture what is happening in that first hour, but I don't want to set the "days" variable to include processing data for an entire additional day for that. But I can't find a solution or workaround. Might you have any idea about what would be an efficient way to capture that first hour without having to define the data capture window using a count back of bars (which in my testing seems to be slower/laggier than using GetDay and GetLastDay)?

EDIT: Interestingly, the test code using GetDay() does not have this problem of a gap now for the time since the Sunday futures open at 6pm, so it appears to only be a problem for the first hour after midnight (not the first hour recorded on the chart for the day).

EDIT 2: I realized (duh) the solution is actually very easy. I just need to add an offset for the bars of the first hour after midnight and then it correctly extends back to that point, (e.g. x_offset = 60, and use the code "if !x[-x_offset] then double.nan").

[ getday() is based on a normal day 9:30 to 4pm. by not exact quantity, i meant what you see if you load a 23hour traded symbol. i should have said it differently. ]
 
https://tlc.thinkorswim.com/center/reference/thinkScript/Functions/Date---Time/GetDay
Returns the number of the current bar day in the CST timezone. The output is returned in the range from 1 through 365 (366 for leap years).

Code:
def BPH =
    AggregationPeriod.HOUR / GetAggregationPeriod();
def RollOver =
    secondsFromTime(0000) < secondsFromTime(0000)[1];
def FwdClose =
    isNaN(getvalue(close,-BPH));
def FwdDay =
    GetValue(GetDay(),-BPH) == GetlastDay();
def IsLastDayEST =
    FwdClose or FwdDay;
assignpriceColor(if IsLastDayEST then color.blue else color.current);
addverticalLine(RollOver and IsLastDayEST,"",color.blue);
 

Join useThinkScript to post your question to a community of 21,000+ developers and traders.

Similar threads

Not the exact question you're looking for?

Start a new thread and receive assistance from our community.

87k+ Posts
425 Online
Create Post

Similar threads

Similar threads

The Market Trading Game Changer

Join 2,500+ subscribers inside the useThinkScript VIP Membership Club
  • Exclusive indicators
  • Proven strategies & setups
  • Private Discord community
  • ‘Buy The Dip’ signal alerts
  • Exclusive members-only content
  • Add-ons and resources
  • 1 full year of unlimited support

Frequently Asked Questions

What is useThinkScript?

useThinkScript is the #1 community of stock market investors using indicators and other tools to power their trading strategies. Traders of all skill levels use our forums to learn about scripting and indicators, help each other, and discover new ways to gain an edge in the markets.

How do I get started?

We get it. Our forum can be intimidating, if not overwhelming. With thousands of topics, tens of thousands of posts, our community has created an incredibly deep knowledge base for stock traders. No one can ever exhaust every resource provided on our site.

If you are new, or just looking for guidance, here are some helpful links to get you started.

What are the benefits of VIP Membership?
VIP members get exclusive access to these proven and tested premium indicators: Buy the Dip, Advanced Market Moves 2.0, Take Profit, and Volatility Trading Range. In addition, VIP members get access to over 50 VIP-only custom indicators, add-ons, and strategies, private VIP-only forums, private Discord channel to discuss trades and strategies in real-time, customer support, trade alerts, and much more. Learn all about VIP membership here.
How can I access the premium indicators?
To access the premium indicators, which are plug and play ready, sign up for VIP membership here.
Back
Top