
Author Message :
This Buy and Sell (non-repainting) indicator uses signals based on the combined CCI/Momentum and RSI indicators and optional regular divergence.
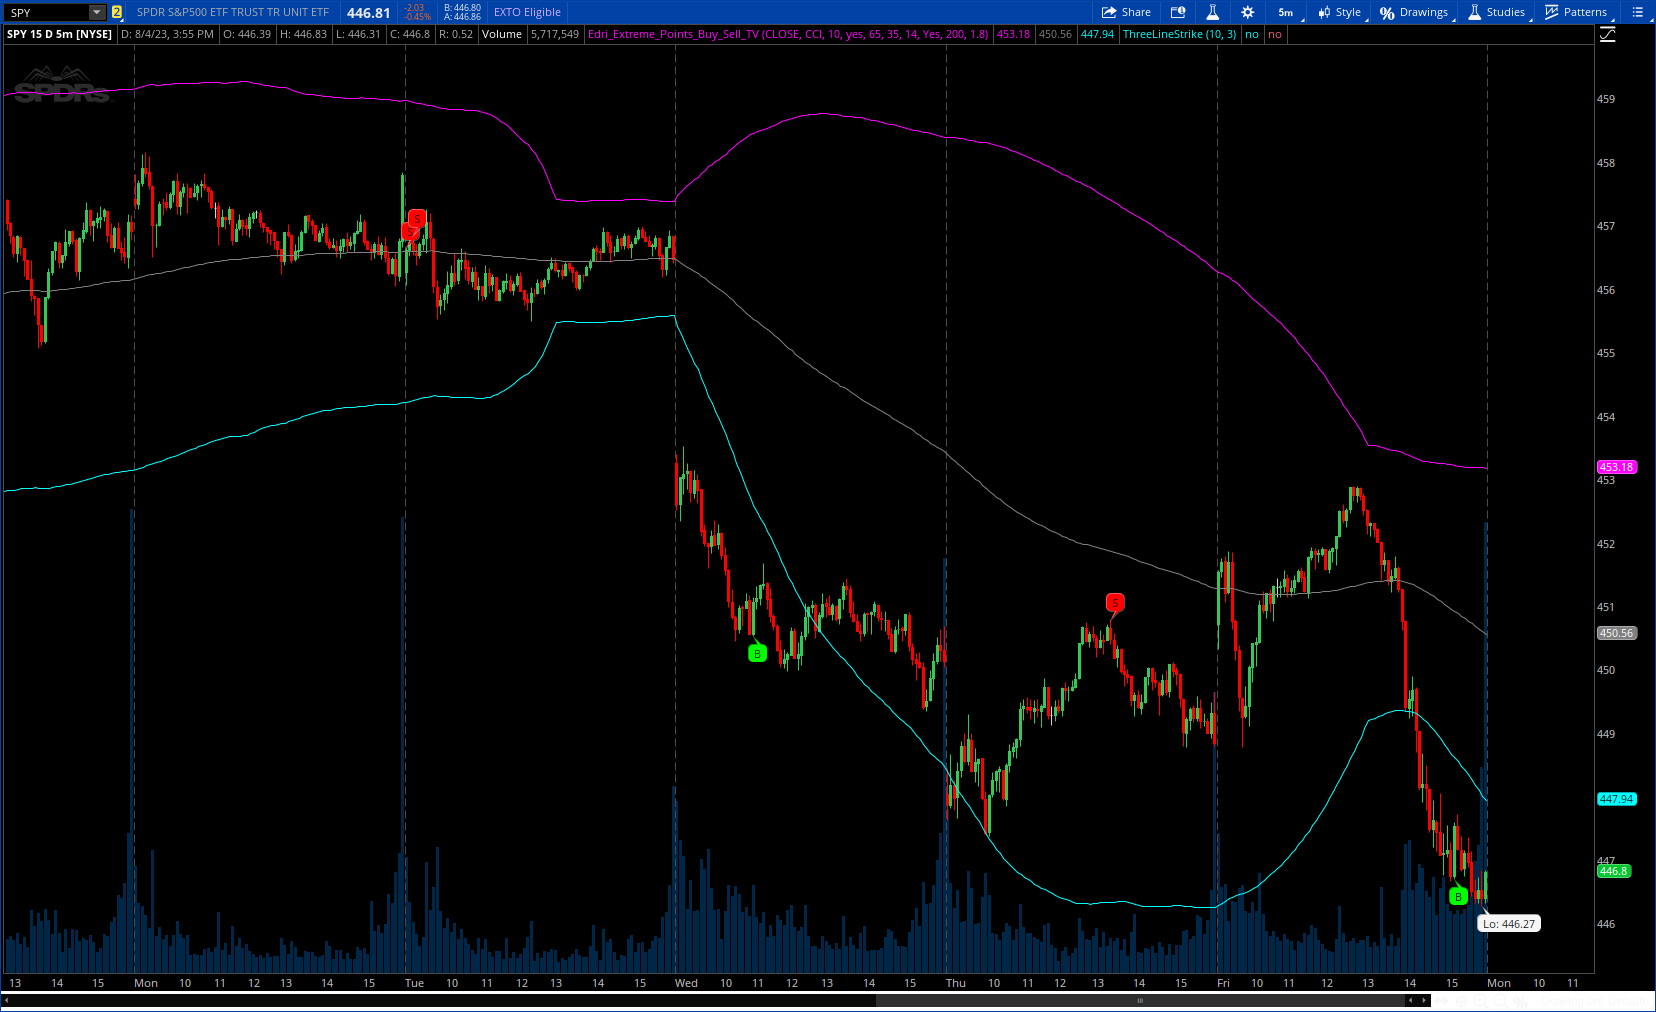
The idea of the indicator is to look for a potential reversal after the price reached extreme points (overbought or oversold) and signals an entry when the price shows signs of momentum for reversal.
Optionally, it considers finding a divergence while RSI is at the extreme levels to improve the predictability of a possible reversal.
More Details : https://www.tradingview.com/v/ZXIm3q7G/
CODE:
CSS:
# https://www.tradingview.com/v/ZXIm3q7G/
#//@rodavlas12
#indicator(title='Edri Extreme Points Buy & Sell', overlay=true, shorttitle='Edri Extreme Points Buy & Sell')
# Converted and mod by Sam4Cok@Samer800    - 08/2023
#// Input settings
input src = close;
input selectIndicator = {"MFI", "Momentum",default "CCI", "Stochastic", "CMO", "Aroon", "DSO"};
input indicatorLength = 10;
input useDivergence = yes;    # 'Only consider an overbought or oversold condition
input rsiOverbought = 65;     # 'RSI Overbought Level'
input rsiOversold = 35;       # 'RSI Oversold Level'
input rsiLength = 14;         # 'RSI Length'
input MeanReversionBand = {default "Yes", "No"};
input emaPeriod = 200;
input bandMultiplier = 1.8;   # 'Outer Bands Multiplier'

def na = Double.NaN;

# stoch(source, high, low, length) =>
script stoch {
    input src = close;
    input h = high;
    input l = low;
    input len = 0;
    def stoch = 100 * (src - Lowest(l, len)) / (Highest(h, len) - Lowest(l, len));
    plot return = stoch;
}
#filt(source,sampling_period,range_mult) =>
script filt {
    input source = close;
    input sampling_period = 50;
    input range_mult = 3;
    def wper      = (sampling_period * 2) - 1;
    def avrng     = ExpAverage(AbsValue(source - source[1]), sampling_period);
    def smoothrng = ExpAverage(avrng, wper) * range_mult;
    def rngfilt = CompoundValue(1, if source > rngfilt[1] then
                  if (source - smoothrng) < rngfilt[1] then rngfilt[1] else (source - smoothrng) else
                  if (source + smoothrng) > rngfilt[1] then rngfilt[1] else (source + smoothrng), source);
    plot out = rngfilt;
}

#// CCI and Momentum calculation
#def momLength;
#switch (SignalSource) {
#case "CCI" :
#    momLength = 10;
#case "Momentum" :
#    momLength = cciMomLength;
#}
def change = src - src[1];
def mom = src - src[indicatorLength];
def ma = Average(src, indicatorLength);
def dev = LinDev(src, indicatorLength);
def cci = (src - ma) / (0.015 * dev);
def CMO   = ChandeMomentumOscillator(Length = indicatorLength);
def stoch = stoch(close, high, low, indicatorLength);
def upper = Sum(volume * If(change <= 0, 0, src), indicatorLength);
def lower = Sum(volume * If(change >= 0, 0, src), indicatorLength);
def mfi = 100.0 - (100.0 / (1.0 + upper / lower));
def Aroon = AroonOscillator(Length = indicatorLength);
def dso = DeviationScaledOscillator(Length = indicatorLength);

def momCrossUp = Crosses(mom, 0, CrossingDirection.ANY);
def cciCrossUp = Crosses(cci, 0, CrossingDirection.ANY);
def stochCrossUp = Crosses(stoch, 20, CrossingDirection.ANY);
def mfiCrossUp = Crosses(mfi, 30, CrossingDirection.ANY);
def cmoCrossUp = Crosses(CMO, -70, CrossingDirection.ANY);
def AroonCrossUp = Crosses(Aroon, -50, CrossingDirection.ANY);
def dsoCrossUp = Crosses(dso, -2, CrossingDirection.ANY);

def momCrossDn = Crosses(mom, 0, CrossingDirection.ANY);
def cciCrossDn = Crosses(cci, 0, CrossingDirection.ANY);
def stochCrossDn = Crosses(stoch, 80, CrossingDirection.ANY);
def mfiCrossDn = Crosses(mfi, 70, CrossingDirection.ANY);
def cmoCrossDn = Crosses(CMO, 70, CrossingDirection.ANY);
def AroonCrossDn = Crosses(Aroon, 50, CrossingDirection.ANY);
def dsoCrossDn = Crosses(dso, 2, CrossingDirection.ANY);

def indCrossUp;def indCrossDn;

switch (selectIndicator) {
case "MFI" :
    indCrossUp = mfiCrossUp;
    indCrossDn = mfiCrossDn;
case "Momentum" :
    indCrossUp = momCrossUp;
    indCrossDn = momCrossDn;
case "CCI" :
    indCrossUp = cciCrossUp;
    indCrossDn = cciCrossDn;
case "Stochastic" :
    indCrossUp = stochCrossUp;
    indCrossDn = stochCrossDn;
case "CMO" :
    indCrossUp = cmoCrossUp;
    indCrossDn = cmoCrossDn;
case "Aroon" :
    indCrossUp = AroonCrossUp;
    indCrossDn = AroonCrossDn;
case "DSO" :
    indCrossUp = dsoCrossUp;
    indCrossDn = dsoCrossDn;
}

def rsi = RSI(Price = close, Length = rsiLength);
def oversoldAgo = rsi <= rsiOversold or rsi[1] <= rsiOversold or rsi[2] <= rsiOversold or rsi[3] <= rsiOversold;
def overboughtAgo = rsi >= rsiOverbought or rsi[1] >= rsiOverbought or rsi[2] >= rsiOverbought or rsi[3] >= rsiOverbought;

#// Regular Divergence Conditions
def bullishDivergenceCondition = rsi > rsi[1] and rsi[1] < rsi[2];
def bearishDivergenceCondition = rsi < rsi[1] and rsi[1] > rsi[2];

#// Entry Conditions
def longEntryCondition = indCrossUp and oversoldAgo and (!useDivergence or bullishDivergenceCondition);
def shortEntryCondition = indCrossDn and overboughtAgo and (!useDivergence or bearishDivergenceCondition);

#// Mean Reversion Indicator
def stdDev = StDev(src, emaPeriod) * bandMultiplier;
def meanReversion;
def upperBand;
def lowerBand;

switch (MeanReversionBand) {
case "Yes" :
    meanReversion = ExpAverage(src, emaPeriod);
    upperBand     = meanReversion + stdDev;
    lowerBand     = meanReversion - stdDev;
case "No" :
    meanReversion = na;
    upperBand     = na;
    lowerBand     = na;
}
#// Plotting
AddChartBubble(longEntryCondition, low, "B", Color.GREEN, no);
AddChartBubble(shortEntryCondition, high, "S", Color.RED);

plot UpBand = upperBand;            # 'Upper Band'
plot MeanLine = meanReversion;      # 'Mean'
plot LoBand = lowerBand;            # 'Lower Band'

UpBand.SetDefaultColor(Color.MAGENTA);
MeanLine.SetDefaultColor(Color.GRAY);
LoBand.SetDefaultColor(Color.CYAN);

#-- END of CODE