EDMA Scalping Strategy For ThinkOrSwim

EmilyK

New member
VIP
The author states:
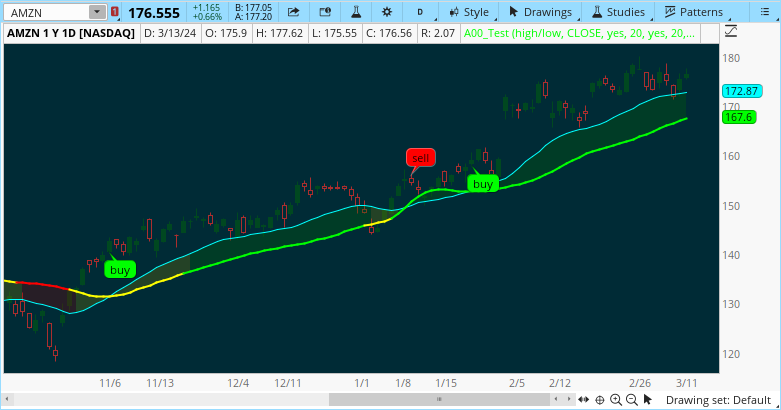
This strategy uses crossover of Exponentially Deviating Moving Average (MZ EDMA) along with Exponential Moving Average for trades entry/exits. Exponentially Deviating Moving Average (MZ EDMA) is derived from Exponential Moving Average to predict better exit in top reversal case.

EDMA Philosophy
EDMA is calculated in following steps:
  • In first step, Exponentially expanding moving line is calculated with same code as of EMA but with different smoothness (1 instead of 2).
  • In 2nd step, Exponentially contracting moving line is calculated using 1st calculated line as source input and also using same code as of EMA but with different smoothness (1 instead of 2).
  • In 3rd step, Hull Moving Average with 2/3 of EDMA length is calculated using final line as source input. This final HMA will be equal to Exponentially Deviating Moving Average.
EDMA Defaults
Currently default EDMA and EMA length is set to 20 period which I've found better for higher timeframes but this can be adjusted according to user's timeframe. I would soon add Multi Timeframe option in script too. Chikou filter's period is set to 25.

Additional Features
  • EMA Band: EMA band is shown on chart to better visualize EMA cross with EDMA.
  • Dynamic Coloring: Chikou Filter library is used for derivation of dynamic coloring of EDMA and its band.
  • Trade Confirmation with Chikou Filter: Trend filteration from Chikou filter library is used as an option to enhance trades signals accuracy.

    Strategy Default Test Settings
    For backtesting purpose, following settings are used:
  • Initial capital=10000 USD
  • Default quantity value = 5 % of total capital
  • Commission value = 0.1 %
  • Pyramiding isn't included.
  • Backtesting data never assures that the same results would occur in future and also above settings use very less of total portfolio for trades, which in a way results less maximum drawdown along with less total profit on initial capital too. For example, increasing default quantity value will definity increase maximum drawdown value. The other way is also to use fix contracts in backtesting but it all depends on users general practice. Best option is to explore backtesting results with manually modified settings on different charts, before trusting them for other uses in future.

    Usage and In-Detail Backtesting
    • This strategy has built-in option to enable trade confirmations with Chikou filter which will reduce the total number of trades increasing profit factor.
    • Symmetrically Weighted Moving Average (SWMA) on input source, may risk repainting in real-time data. Better option is to run a trade on bar close or simply left this optin unchecked.
    • I've set Chikou filter unchecked to increase number of trades (greater than 100) on higher timeframe (12H) and this can be changed according to your precision requirement and timeframe.
    • Timeframes lower than 4H usually have more noise. So its better to use higher EDMA and EMA length on lower timeframes which will decrease total number of offsetting trades increasing average total number of bars within a single trade.
x263rOa.png


@samer800 Can you please help convert this indicator: Exponentially Deviating Moving Average
https://www.tradingview.com/script/...ategy-Exponentially-Deviating-Moving-Average/

Thank you so much for all your work - you are the best! :love:
 
Last edited by a moderator:
  • Love
Reactions: IPA
@samer800 Can you please help convert this indicator: Exponentially Deviating Moving Average
https://www.tradingview.com/script/...ategy-Exponentially-Deviating-Moving-Average/

Thank you so much for all your work - you are the best! :love:
check the below:
CSS:
#// This source code is subject to the terms of the Mozilla Public License 2.0 at https://mozilla.org/MPL/2.0/
#// © MightyZinger
#strategy('EDMA Scalping Strategy (Exponentially Deviating Moving Average)', shorttitle='MZ EDMA Strategy'
# Converted by Sam4Cok@Samer800    - 03/2024

input SourcesOptions = {"source setup", "(open+close+3(high+low))/8", "close+high+low-2*open",
                      "(close+5(high+low)-7(open))/4", "(open+close+5(high+low))/12", default "high/low",
                      "Heiken-ashi High/Low"}; # Different Sources Options'
input sourceSetup = close; # Tradingview Source Setup'
input sourceSwmaSmoothing = yes; # 'Apply Symmetrically Weighted Moving Average at the price source (May Result Repainting)'
input edma_Length = 20; #, title='MA Length:', group=grp1)
input edmaSwmaSmoothing = yes; # '‍ Apply Symmetrically Weighted Moving Average at EDMA')
input ema1_Length = 20; #, title='EMA 1 Length:', group=grp1)
input show_ema1 = yes; #, '‍ Show EMA 1')
input ema2_Length = 40; #, title='EMA 2 Length:', group=grp1)
input show_ema2 = no; #, '‍ Show EMA 2')
input ChikouPeriod = 25; #, title='Chikou Period (Displaced Source)', group=grp2)
input showSignals = yes; #(true, title='Show Cross Alerts', group=grp4)
input UseChikouFilter = no; #(false, title='Use Chikou Filter for Confirmation', group=grp4)

def na = Double.NaN;

#// ─── Different Sources Options List ───► [
#def SRC_Tv = diff_src == diff_src."Use traditional TradingView Sources";
def SRC_Wc  = SourcesOptions == SourcesOptions."(open+close+3(high+low))/8";
def SRC_Wo  = SourcesOptions == SourcesOptions."close+high+low-2*open";
def SRC_Wu  = SourcesOptions == SourcesOptions."(close+5(high+low)-7(open))/4";
def SRC_Wi  = SourcesOptions == SourcesOptions."(open+close+5(high+low))/12";
def SRC_Exi = SourcesOptions == SourcesOptions."high/low";
def SRC_Exj = SourcesOptions == SourcesOptions."Heiken-ashi High/Low";

#// same on pine, but less efficient
script swma {
    input x = close;
    def swma = x[3] * 1 / 6 + x[2] * 2 / 6 + x[1] * 2 / 6 + x[0] * 1 / 6;
    plot out = swma;
}
#/ EDMA Function
script f_edma {
    input src = close;
    input len = 14;
    def smoothness = 1.0;
    def h_len = Floor(len / 1.5);
    def hexp = if (hexp[1] == 0) then src else
               if src >= hexp[1] then src else hexp[1] + (src - hexp[1]) * (smoothness / (len + 1));
    def lexp = if (lexp[1] == 0) then hexp else
               if src <= lexp[1] then hexp else lexp[1] + (src - lexp[1]) * (smoothness / (len + 1));
    def _hma = HullMovingAvg(lexp, h_len);
    plot _edma = if _hma then _hma else src;
}
#/ @Chikou Filter for Ichimoku Cloud with Color and Signal Output
Script chikou {
input src = close;
input len = 14;
    def hh = highest(high, len)[len];
    def ll = lowest(low, len)[len];
    def _up = src > hh;
    def _dn = src < ll;
    def _re = src < hh and src > ll;
    def sig = if _up then 1 else if _dn then -1 else 0;
    plot out = sig;
}

#// Heikinashi Candles for calculations
def h_open;
def hOpen = if h_open[1] == 0 then (open + close) / 2 else h_open[1];
h_open = if IsNaN(hOpen) then (open + close) / 2 else  (hOpen + ohlc4[1]) / 2;

#// Get Source
def src_o = if SRC_Wc then (open + close + 3 * (high + low)) / 8 else
            if SRC_Wo then (close + high + low - (2 * open))  else
            if SRC_Wu then (close + 5 * (high + low) - (7 * open)) / 4 else
            if SRC_Wi then (open + close + 5 * (high + low)) / 12 else
            if SRC_Exi then (if close > open then high else low) else
            if SRC_Exj then (if ohlc4 > h_open then high else low) else sourceSetup;

def src_f = if sourceSwmaSmoothing then swma(src_o) else src_o; # // Symmetrically Weighted Moving Average?
def f_edma = f_edma(src_f, edma_Length);
def edma = if edmaSwmaSmoothing then swma(f_edma) else f_edma;
def ema1 = ExpAverage(src_f, ema1_Length);
def ema2 = ExpAverage(src_f, ema2_Length);
def _trend = chikou(src_f, ChikouPeriod);

plot edma_plot = edma; # 'EDMA', color= edma_col , linewidth=4)
plot ema1_plot = if show_ema1 then ema1 else na; #, title='EMA 1', color= ema1_col , linewidth=3)
plot ema2_plot = if show_ema2 then ema2 else na; #, title='EMA 2', color= ema2_col , linewidth=3)
edma_plot.SetLineWeight(2);
edma_plot.AssignValueColor(if _trend > 0 then Color.GREEN else
                           if _trend < 0 then Color.RED else Color.YELLOW);
ema1_plot.SetDefaultColor(Color.CYAN);
ema2_plot.SetDefaultColor(Color.MAGENTA);

AddCloud(if _trend > 0 or _trend[1] > 0 then ema1_plot else na, edma_plot, Color.DARK_GREEN, Color.DARK_GREEN);
AddCloud(if _trend < 0 or _trend[1] < 0 then ema1_plot else na, edma_plot, Color.DARK_RED, Color.DARK_RED);
AddCloud(if _trend == 0 or _trend[1] == 0 then ema1_plot else na, edma_plot,CreateColor(118,118,0), CreateColor(118,118,0));

#// Trade Signals and Alerts
def L1 = ema2 > edma; #    // Weak Uptrend Condition
def L2 = ema1 > edma; #    // Strong Uptrend Condition
def L3 = _trend == 1; #    // Chikou Filter Uptrend Condition
def S1 = ema2 < edma; #    // Weak Downtrend Condition
def S2 = ema1 < edma; #    // Strong Downtrend Condition
def S3 = _trend == -1; #   // Chikou Filter Downtrend Condition
#// Setting confirmation conditional operator for Chikou Filter
def weak_up   = if UseChikouFilter then L1 and L3 else L1;
def strong_up = if UseChikouFilter then L2 and L3 else L2;
def weak_dn   = if UseChikouFilter then S1 and S3 else S1;
def strong_dn = if UseChikouFilter then S2 and S3 else S2;

def sig1;
def sig0 = if weak_up and sig1[1] <= 0 then 1 else
           if weak_dn and sig1[1] >= 0 then -1 else sig1[1];
    sig1 = if strong_up and sig0 <= 0 then 1 else
           if strong_dn and sig0 >= 0 then -1 else sig0;

def buy_weak    = sig0 == 1 and sig0[1] != 1;
def buy_strong  = sig1 == 1 and sig1[1] != 1;
def sell_weak   = sig0 ==-1 and sig0[1] !=-1;
def sell_strong = sig1 ==-1 and sig1[1] !=-1;

AddChartBubble(showSignals and buy_strong, low, "buy", Color.GREEN, no);
AddChartBubble(showSignals and sell_strong, high, "sell", Color.RED);

#-- END of CODE
 
The Tradingview OP shows using this indicator on a 12hr chart for trading bitcoin. This seems to be the Tradingview usage for most of the scripts that have been ported from there.

How might forum members use this script?
This is a moving average script.
The default moving average lengths of 20 and 40 can be used in longer daytrades and for swinging.
Which means that you can apply this indicator to both the middle and higher of your three-timeframe analysis

@mailbagman2000,
It will be helpful if you come back with your experience of how you found to use this script.
 
Last edited:
check the below:
Hello, I am very interested in your work! I think it's brilliant! Would there be a possibility of expanding your strategy, so that it makes a profit/loss report, from a date to be selected to the present?
Example: when detecting a buy, it takes the closing price and then compares it with the next sell detection; then compares (short) the sale price with the next purchase price, and so on until today. You could start with an initial capital of $10,000 and reinvest. Then the report would reflect the resulting amount.-
I appreciate your comments.-
 

Join useThinkScript to post your question to a community of 21,000+ developers and traders.

Similar threads

Not the exact question you're looking for?

Start a new thread and receive assistance from our community.

87k+ Posts
393 Online
Create Post

Similar threads

Similar threads

The Market Trading Game Changer

Join 2,500+ subscribers inside the useThinkScript VIP Membership Club
  • Exclusive indicators
  • Proven strategies & setups
  • Private Discord community
  • ‘Buy The Dip’ signal alerts
  • Exclusive members-only content
  • Add-ons and resources
  • 1 full year of unlimited support

Frequently Asked Questions

What is useThinkScript?

useThinkScript is the #1 community of stock market investors using indicators and other tools to power their trading strategies. Traders of all skill levels use our forums to learn about scripting and indicators, help each other, and discover new ways to gain an edge in the markets.

How do I get started?

We get it. Our forum can be intimidating, if not overwhelming. With thousands of topics, tens of thousands of posts, our community has created an incredibly deep knowledge base for stock traders. No one can ever exhaust every resource provided on our site.

If you are new, or just looking for guidance, here are some helpful links to get you started.

What are the benefits of VIP Membership?
VIP members get exclusive access to these proven and tested premium indicators: Buy the Dip, Advanced Market Moves 2.0, Take Profit, and Volatility Trading Range. In addition, VIP members get access to over 50 VIP-only custom indicators, add-ons, and strategies, private VIP-only forums, private Discord channel to discuss trades and strategies in real-time, customer support, trade alerts, and much more. Learn all about VIP membership here.
How can I access the premium indicators?
To access the premium indicators, which are plug and play ready, sign up for VIP membership here.
Back
Top