#horz_lines_4hour_00
#https://usethinkscript.com/forums/questions.6/
#draw a horizontal line indicator request.
#METAL 1/12
#1
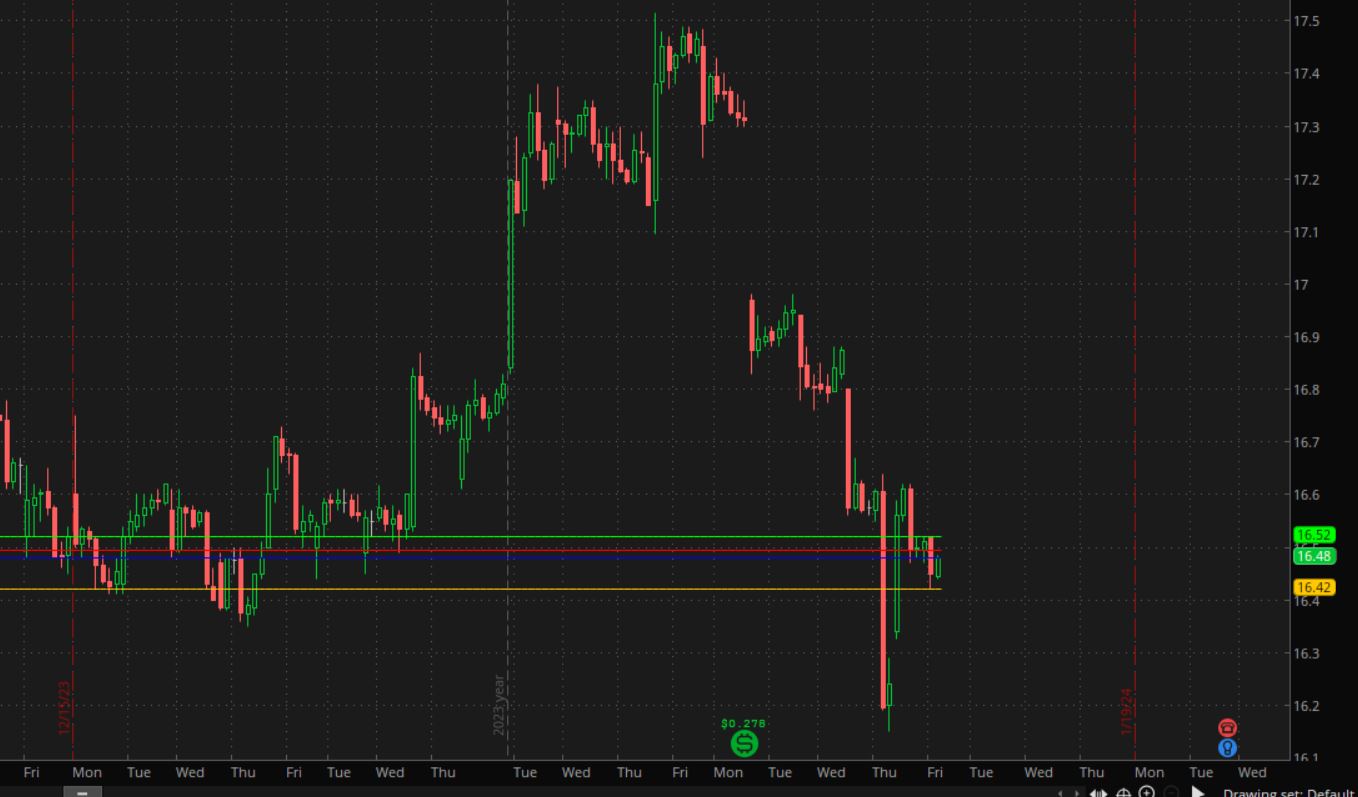
#Is there a way to draw a horizontal line from the top of wick, bottom of wick, top of body, and low of body on a specific TF for a specific length.
#For example: on a 4H TF, I would like a line drawn from the mentioned areas across the current days chart. I would like to be able to specify the length back for it to draw the lines from. Thanks in advance.
#METAL
#2
#Maybe someone can help. I have been trying to get this to work and cannot figure out what is wrong. I decided to use the Wolf Wave Trend by Mobius/ @BenTen as a base for the line plots. I do not get any errors but I also do not get any plots.
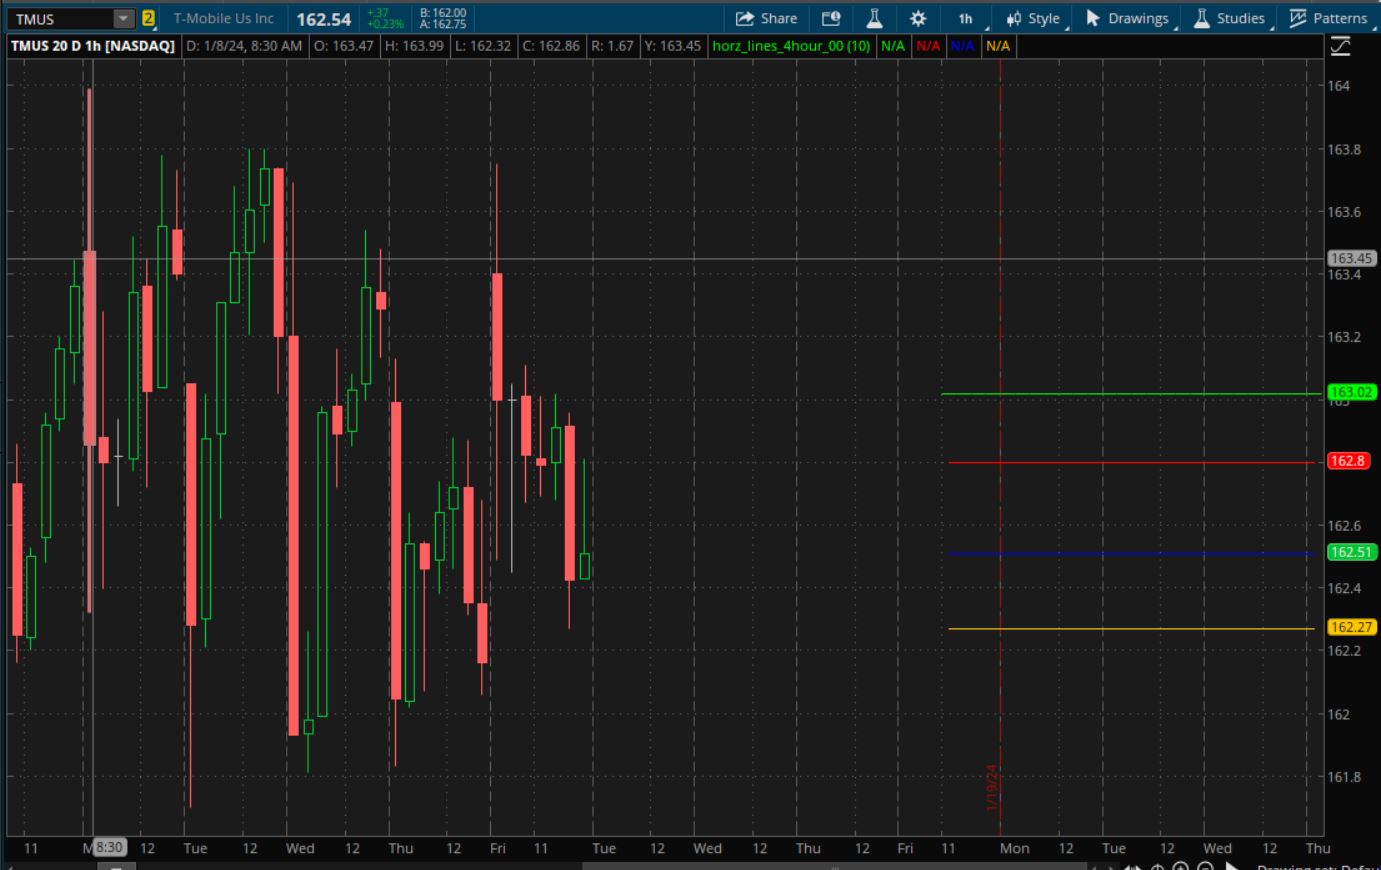
#I am wanting line plots from High, Open, Close, and Low of each 4 hour candle as far back as I need for current trading day. I have been using the "RV strategy" for scalping. I am simply looking for a way to speed up the lines needed for possible reversals with this strategy. It will plot a lot of lines and look crazy, but it does work so far.
#I would like to be able to change the aggregation to maybe a day or whatever.
#Here is what I have so far. Chat GPT was also used.
# User Inputs
input length = 10;
# Internal Script Reference
script LinePlot {
input BarID = 0;
input Value = 0;
input BarOrigin = 0;
# def ThisBar = HighestAll(BarOrigin);
def ThisBar = HighestAll(if isnan(close) then 0 else BarOrigin);
# def ValueLine = if BarOrigin == ThisBar
# then Value
# else Double.NaN;
# plot P = if ThisBar - BarID <= BarOrigin
# then HighestAll(ValueLine)
# else Double.NaN;
plot P = if ThisBar - BarID <= BarOrigin
then HighestAll(if BarOrigin == ThisBar then Value else 0)
else Double.NaN;
}
# Define Aggregation Period
def agg = AggregationPeriod.FOUR_HOURS;
# Calculate High, Open, Close, Low for each 4-hour bar
def high_4H = high(period = agg);
def open_4H = open(period = agg);
def close_4H = close(period = agg);
def low_4H = low(period = agg);
def x = BarNumber();
# Plots
plot HighLine = LinePlot(BarID = x - HighestAll(x),
Value = high_4H,
BarOrigin = x);
HighLine.SetDefaultColor(Color.GREEN);
highline.SetPaintingStrategy(PaintingStrategy.HORIZONTAL);
plot OpenLine = LinePlot(BarID = x - HighestAll(x),
Value = open_4H,
BarOrigin = x);
OpenLine.SetDefaultColor(Color.RED);
#x.SetPaintingStrategy(PaintingStrategy.HORIZONTAL);
plot CloseLine = LinePlot(BarID = x - HighestAll(x),
Value = close_4H,
BarOrigin = x);
CloseLine.SetDefaultColor(Color.BLUE);
#x.SetPaintingStrategy(PaintingStrategy.HORIZONTAL);
plot LowLine = LinePlot(BarID = x - HighestAll(x),
Value = low_4H,
BarOrigin = x);
LowLine.SetDefaultColor(Color.ORANGE);
#x.SetPaintingStrategy(PaintingStrategy.HORIZONTAL);
addchartbubble(0, low,
open_4h + "\n" +
high_4h + "\n" +
low_4h + "\n" +
close_4h + "\n" +
highline + "\n"
, color.yellow, no);
#