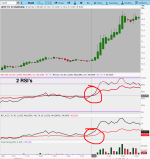
Double RSI

JP782

Active member
Need some help to fix this double RSI Im getting an error msg. This code works but doesnt show the cross(which is the whole point of making the custom study) you see if you just run 2 RSI's w/diff lengths bc I cant change the ABSValue to ABSValueA for the 2nd RSI to differentiate from the 1st one

Suggestions??

Code:
declare lower;

input length = 25;
input over_Bought = 70;
input over_Sold = 30;
input price = close;
input averageType = AverageType.WILDERS;

def NetChgAvg = MovingAverage(averageType, price - price[1], length);
def TotChgAvg = MovingAverage(averageType, AbsValue(price - price[1]), length);
def ChgRatio = if TotChgAvg != 0 then NetChgAvg / TotChgAvg else 0;

plot RSI = 50 * (ChgRatio + 1);
RSI.setlineWeight(2);
RSI.setDefaultColor(color.black);

#
input lengthA = 100;
input over_BoughtA = 70;
input over_SoldA = 30;
input priceA = close;
input averageTypeA = AverageType.WILDERS;

def NetChgAvgA = MovingAverage(averageTypeA, priceA - priceA[1], lengthA);
def TotChgAvgA = MovingAverage(averageTypeA, AbsValue(priceA - priceA[1]), lengthA);
def ChgRatioA = if TotChgAvgA != 0 then NetChgAvgA / TotChgAvgA else 0;

plot RSI_ = 50 * (ChgRatioA + 1);
RSI_.setlineWeight(2);
RSI_.setDefaultColor(color.red);

8YsmqqF.png
k97LkhS.png
 

Attachments

  • 8YsmqqF.png
    8YsmqqF.png
    117.5 KB · Views: 977
Henry1224, thank you for posting this thoughtful Thinkscript. Even to my untrained eye, there is quite a lot of useful information discerned while running it on one of the major indices such as /ES or /NQ, although I wonder if I'm making even close to the optimal use of what it's saying. Clearly, the transition upwards through the 1.0 line is bullish, and downwards through that line is bearish. However, what is the significance of the green versus green/blue shading? Likewise with the purple vs. purple/red shading? I assume the yellow arrow is intended to warn that a bullish trend may be coming to an end? Likewise, an orange arrow appears to warn that a bearish trend is coming to an end? Concerning the latter, I'm struck how prescient the orange arrow appears to be, although I'm wondering also about what the repainting may be doing to my sensibility about that seeming accuracy. Would appreciate your thoughts. In any case, it's a pristine Thinkscript and thank you for sharing it.
The Three RSI Difference is the base of my studies using the RSI difference. The first Diff is based on a 1/4 ratio, the second Diff is based on a 1/3 ratio Fast Rsi vs Med RSI, Med RSI vs long RSI.

this then led me to do a Binary version using 14 iterations of the Two RSI difference

Let's start with the base indicator" Two RSI Difference, The fast RSI and the Slower RSI. When divided it produces a percentage of of the fast RSI above the base "Slow"RSI. with 1 as the base line. anything above 1 : the fast RSI is greater than the Slow RSI "A bullish condition" Anything below 1 : The fast RSI is below the Slow RSI" A bearish condition"

If we then take a deviation channel of the fast RSI, The yellow dots occur when the Fast RSI is above the upper Deviation channel, and orange Dots when it is below the lower channel Thus giving you an early warning system.

The Cyan and Magenta Lines represent a one day change of the base using shorter term lengths.
The Blue and Red Lines represent a one day change of the base using longer term lengths.
We can then see a difference between traders and investors

The Green, Dark_Green Light_Red and Dark_Red Lines represent a binary version of a histogram that shows when the "Base indicator is above 1 and rising, when the base indicator is above 1 and falling, when the base indicator is below 1 and rising and when the base indicator is below 1 and falling.

There are 14 base indicators : 7 short term and 7 long term.

All base indicators are formulated using a 1 to 4 ratio in lengths 3/12, 5/20 , 8/32 10/40 and so forth

the use of the APC input allows the user to visually see how the separate lines would look on the "Price Chart"
by inputting the LINE Number that you would like to see.

There is no repainting since there is no use of a MTF Aggregation , what you see, is what you get, Bar to bar changes based on the difference of the Base indicator over 14 iterations
 
Last edited:
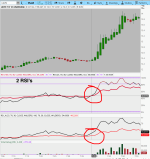
Need some help to fix this double RSI Im getting an error msg. This code works but doesnt show the cross(which is the whole point of making the custom study) you see if you just run 2 RSI's w/diff lengths bc I cant change the ABSValue to ABSValueA for the 2nd RSI to differentiate from the 1st one

Suggestions??

Code:
declare lower;

input length = 25;
input over_Bought = 70;
input over_Sold = 30;
input price = close;
input averageType = AverageType.WILDERS;

def NetChgAvg = MovingAverage(averageType, price - price[1], length);
def TotChgAvg = MovingAverage(averageType, AbsValue(price - price[1]), length);
def ChgRatio = if TotChgAvg != 0 then NetChgAvg / TotChgAvg else 0;

plot RSI = 50 * (ChgRatio + 1);
RSI.setlineWeight(2);
RSI.setDefaultColor(color.black);

#
input lengthA = 100;
input over_BoughtA = 70;
input over_SoldA = 30;
input priceA = close;
input averageTypeA = AverageType.WILDERS;

def NetChgAvgA = MovingAverage(averageTypeA, priceA - priceA[1], lengthA);
def TotChgAvgA = MovingAverage(averageTypeA, AbsValue(priceA - priceA[1]), lengthA);
def ChgRatioA = if TotChgAvgA != 0 then NetChgAvgA / TotChgAvgA else 0;

plot RSI_ = 50 * (ChgRatioA + 1);
RSI_.setlineWeight(2);
RSI_.setDefaultColor(color.red);
8YsmqqF.png
k97LkhS.png
Did ever find a dual line RSI script? I can find all sorts of iterations, but not a simple two line script. I would like to use the a slower trend RSI line and a faster take profit or entry RSI line. I probably have 10 scripts, and not what I'm lookin for. We are looking for the same thing. I'd like a 50 line, then OB and OS lines.
 

Attachments

  • 8YsmqqF.png
    8YsmqqF.png
    117.5 KB · Views: 207

Join useThinkScript to post your question to a community of 21,000+ developers and traders.

Similar threads

Not the exact question you're looking for?

Start a new thread and receive assistance from our community.

87k+ Posts
335 Online
Create Post

Similar threads

Similar threads

The Market Trading Game Changer

Join 2,500+ subscribers inside the useThinkScript VIP Membership Club
  • Exclusive indicators
  • Proven strategies & setups
  • Private Discord community
  • ‘Buy The Dip’ signal alerts
  • Exclusive members-only content
  • Add-ons and resources
  • 1 full year of unlimited support

Frequently Asked Questions

What is useThinkScript?

useThinkScript is the #1 community of stock market investors using indicators and other tools to power their trading strategies. Traders of all skill levels use our forums to learn about scripting and indicators, help each other, and discover new ways to gain an edge in the markets.

How do I get started?

We get it. Our forum can be intimidating, if not overwhelming. With thousands of topics, tens of thousands of posts, our community has created an incredibly deep knowledge base for stock traders. No one can ever exhaust every resource provided on our site.

If you are new, or just looking for guidance, here are some helpful links to get you started.

What are the benefits of VIP Membership?
VIP members get exclusive access to these proven and tested premium indicators: Buy the Dip, Advanced Market Moves 2.0, Take Profit, and Volatility Trading Range. In addition, VIP members get access to over 50 VIP-only custom indicators, add-ons, and strategies, private VIP-only forums, private Discord channel to discuss trades and strategies in real-time, customer support, trade alerts, and much more. Learn all about VIP membership here.
How can I access the premium indicators?
To access the premium indicators, which are plug and play ready, sign up for VIP membership here.
Back
Top