Is it possible to display a label showing the daily percentage change of the current symbol, even if the chart is on a different timeframe, such as a 5-minute or weekly timeframe?
The following code successfully displays the daily percentage change, but only on the daily timeframe. On other timeframes, it shows either zero or 'n/a'. On weekly and monthly timeframes, it does not display at all, and I receive this error message: "Secondary period cannot be less than primary".
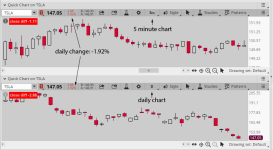
If this isn't possible, could you kindly advise me on how to display the daily price change on the chart, regardless of the timeframe? The TOS % change displayed at the top of each chart is written very small among the bid/ask/last prices, and I'm unable to increase the font size without globally enlarging the font size in 'Application Settings'.
Thank you!
Alex
The following code successfully displays the daily percentage change, but only on the daily timeframe. On other timeframes, it shows either zero or 'n/a'. On weekly and monthly timeframes, it does not display at all, and I receive this error message: "Secondary period cannot be less than primary".
Code:
def c = close(period = AggregationPeriod.DAY);
AddLabel(yes, Round(((c - c[1]) / c[1]) * 100, 2) + "%", Color.BLACK);
If this isn't possible, could you kindly advise me on how to display the daily price change on the chart, regardless of the timeframe? The TOS % change displayed at the top of each chart is written very small among the bid/ask/last prices, and I'm unable to increase the font size without globally enlarging the font size in 'Application Settings'.
Thank you!
Alex
Last edited: