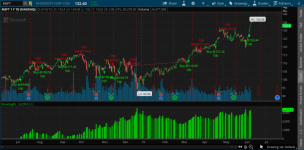
DEMA Crossover with Heikin-Ashi Candle Confirmation for ThinkorSwim

theelderwand

Active member
2019 Donor
VIP
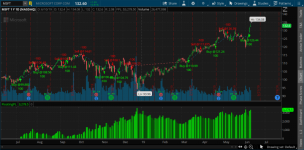
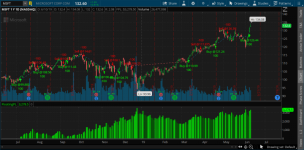
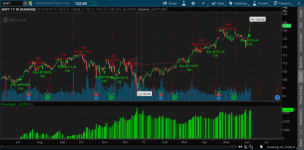
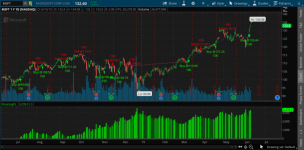
Built up this DEMA Crossover strategy with Heikin-Ashi candle confirmation. Works best in Daily setup.

wLa2tbp.png


ThinkScript Code

Rich (BB code):
def demaSlow = DEMA(close, 8);
def demaFast = DEMA(close, 21);

def HAclose = ohlc4;
def HAopen = CompoundValue(1,(HAopen[1] + HAclose[1]) / 2,
(open[1] + close[1]) / 2);
def HAhigh = Max(Max(high, HAopen), HAclose);
def HAlow = Min(Min(low, HAopen), HAclose);

def demaCrossingOverGoingDown = demaSlow[1] > demaFast[1] and demaSlow < demaFast;
def demaCrossingOverGoingUp = demaSlow < demaFast and demaSlow[-1] > demaFast[-1];

def HARed = HAOpen > HAclose;
def HAGreen = !HARed;
def HADecidedRed = HARed and HAHigh == HAopen;
def HADecidedGreen = HAGreen and HAlow == HAOpen;

def sell = demaCrossingOverGoingDown and (HADecidedRed or HADecidedRed[1] or HADecidedRed[2]);

def buy = demaCrossingOverGoingUp and (HADecidedGreen or HADecidedGreen[1] or HADecidedGreen[2]);

AddOrder(OrderType.SELL_AUTO, sell equals 1, open, 100, Color.RED, Color.RED, "Sell @" + open);
AddOrder(OrderType.BUY_AUTO, buy equals 1, open, 100, Color.GREEN, Color.GREEN, "Buy @" + open);
 

Attachments

  • wLa2tbp.png
    wLa2tbp.png
    148.3 KB · Views: 542
Last edited by a moderator:

Join useThinkScript to post your question to a community of 21,000+ developers and traders.

Thanks for sharing. May i know if what indicator can we use to measure the strength of the momemtum when DEMA shows a positive signal?

 
Last edited:
Built up this DEMA Crossover strategy with Heikin-Ashi candle confirmation. Works best in Daily setup.

wLa2tbp.png


ThinkScript Code

Rich (BB code):
def demaSlow = DEMA(close, 8);
def demaFast = DEMA(close, 21);

def HAclose = ohlc4;
def HAopen = CompoundValue(1,(HAopen[1] + HAclose[1]) / 2,
(open[1] + close[1]) / 2);
def HAhigh = Max(Max(high, HAopen), HAclose);
def HAlow = Min(Min(low, HAopen), HAclose);

def demaCrossingOverGoingDown = demaSlow[1] > demaFast[1] and demaSlow < demaFast;
def demaCrossingOverGoingUp = demaSlow < demaFast and demaSlow[-1] > demaFast[-1];

def HARed = HAOpen > HAclose;
def HAGreen = !HARed;
def HADecidedRed = HARed and HAHigh == HAopen;
def HADecidedGreen = HAGreen and HAlow == HAOpen;

def sell = demaCrossingOverGoingDown and (HADecidedRed or HADecidedRed[1] or HADecidedRed[2]);

def buy = demaCrossingOverGoingUp and (HADecidedGreen or HADecidedGreen[1] or HADecidedGreen[2]);

AddOrder(OrderType.SELL_AUTO, sell equals 1, open, 100, Color.RED, Color.RED, "Sell @" + open);
AddOrder(OrderType.BUY_AUTO, buy equals 1, open, 100, Color.GREEN, Color.GREEN, "Buy @" + open);

Thanks for your sharing..
May i know how can we remove the labels? All i would like to see is only the arrows up or down. Secondly, can this be configured into a scan?

May i also know what does those "dash line and its colour" mean to us?

Thanks again.
 

Attachments

  • wLa2tbp.png
    wLa2tbp.png
    148.3 KB · Views: 350
Looking at more detail - looks like trade entry and trade close for this strategy are not actual price close. Many of the entries would of never been hit in live trading and many of the closes would of been worst in live trading. This is due to the Heikin-Ashi candle in the code.
 
@mc01439 You are right. The code @theelderwand provided includes “open” instead of “close” for the order trigger. Maybe its better to have it as close so that we can actually wait for confirmation. Regarding the Heiken im not too familiar with how it works in an automated environment.
 
@mc01439 You are right. The code @theelderwand provided includes “open” instead of “close” for the order trigger. Maybe its better to have it as close so that we can actually wait for confirmation. Regarding the Heiken im not too familiar with how it works in an automated environment.

@BenTen - Your correct. Cut the profits a lot but still profitable on Daily, Weekly and Monthly with code changed from open to close.
 
In some live trades at this time will check this afternoon.

@markos - as requested

5000 tick from week of March 4, 2019 trading 1 /CL contract. Used “OnDemand” due to ticks being limited to 5 days of data,

Week Trades Profit/Loss

3/4 14 $2230

3/11 11 $360

3/18 11 $770

3/25 14 $150

4/1 12 $3680

4/8 15 $200

4/15 14 -$1410

4/22 14 $3780

4/29 11 $2270

5/6 16 -$1119

5/13 15 $170

5/20 12 $1260

5/27 14 $5540

6/3 15 $2520

6/10 18 $1870

6/17 12 -$220

6/24 9 $3510

7/1 15 -$2280

7/8 19 -$210

7/15 8 $3010

Total P/L $26081

Trading cost set high @ $10.00 per round trip trade = $2600.

Total before slippage = $23481

If you traded as is would take some very large drawdowns.
 
@mc01439 Thank you for the update. I understand it's a backtested strategy but what are your thoughts between this and the RSILg as far as the oil trade?
Do you follow #OOTT on twitter? That's where the Prop Traders hang out.
 
@markos

I do not use twitter so no to #OOTT.

The gamma of RSILg does a good job of pointing out possible exhaustion and consolidating points. Have not figured out a good way to back test other than the old time visual test. RSI by itself does not test out that well.

RSI and Gamma tested as
#######################################################################
def BuySignal = RSI crosses above .10 and gamma < .382;
def SellSignal = RSI crosses below .90 and gamma < .382;
#######################################################################
3200 Tick
Date
Trades
Profit/Loss
4-May​
3​
$20.00​
1 Hr 90 days
11-May​
6​
$2,000.00​
($10,460.00)​
18-Mar​
2​
$650.00​
25-Mar​
4​
$850.00​
4 Hr 180 days
1-Apr​
3​
$2,810.00​
$3,070.00​
8-Apr​
4​
$350.00​
15-Apr​
2​
$360.00​
1 day 1yr
22-Apr​
1​
($2,810.00)​
$16,170.00​
29-Apr​
3​
$890.00​
6-May​
4​
($1,860.00)​
1 day 5yr
13-May​
1​
$1,140.00​
$39,620.00​
22-May​
4​
$1,680.00​
27-May​
3​
($2,300.00)​
3 day 5yr
3-Jun​
4​
($3,210.00)​
($29,970.00)​
10-Jun​
2​
($1,580.00)​
17-Jun​
3​
$610.00​
1 wk 10 yr
24-Jun​
1​
($3,530.00)​
($16,900.00)​
1-Jul​
3​
$670.00​
8-Jul​
2​
$750.00​
15-Jul​
0​
$0.00​
($2,510.00)​

This was signal to signal with no stops or profit targets using /CL 1 contract. 1, 5 and 15 minute charts did no better than 3200 tick charts.
 
Last edited:
Thanks @mc01439 but I do see a little potential problem, please feel free to push back at me. Gamma in this indicator is not a signal in itself, but a 'signal' that movement up or down is coming.
These don't seem quite right right:
def BuySignal = RSI crosses above .10 and gamma < .382;
def SellSignal = RSI crosses below .90 and gamma < .382;
The Buy Long and Sell Short are correct on the RSI Laguerre. However, the gamma (Fractal Energy or Chop in other indicators) should be over .6 to show that the 'coil is wound up and ready to spring'. <.382 is indication of exhaustion, so the move would probably not have much strength.

This was lifted in pieces from Mobius in 2016 ThinkScript Lounge Conversations, The full synopsis is 2 single spaced pages long:

# SYNOPSIS This indicator does NOT indicate OB or OS but linear or non-linear. The closer to 1 the more non-linear (compressed or random) price is. The closer to 0 the more linear (trending) price is.
# Fractal Energy isn't an indicator - it's a way of looking at price to see if it's linear or random.
There are NO trading signals on the FE study. Only signals NOT to trade.
# If the FE is at extremes, something is about to change. It's leading you to a conclusion. If the FE is below .382, price is parabolic and cannot maintain that. But you may not want to sell because it may still go further in its trend and it may not change direction right away. It's telling you though that it's not going to stay trending at the current rate of speed. If it's over .618 it’s telling you price is compressing and going sideways, rebuilding energy, and getting ready for another run one way or the other.
# Using price in fractals and different times, or ORB with FE and Supertrend or some way to measure when price expansion is contracting or expanding is all you need. Any more than that and you'll be paralyzed by information overload.

I was curious, you don't need to persue this on my behalf. Besides, this thread is about DEMA Crossover and I shouldn't hijack the thread.
Thanks, Markos

@markos
Moved my reply to the correct thread.
 
Built up this DEMA Crossover strategy with Heikin-Ashi candle confirmation. Works best in Daily setup.

wLa2tbp.png


ThinkScript Code

Rich (BB code):
def demaSlow = DEMA(close, 8);
def demaFast = DEMA(close, 21);

def HAclose = ohlc4;
def HAopen = CompoundValue(1,(HAopen[1] + HAclose[1]) / 2,
(open[1] + close[1]) / 2);
def HAhigh = Max(Max(high, HAopen), HAclose);
def HAlow = Min(Min(low, HAopen), HAclose);

def demaCrossingOverGoingDown = demaSlow[1] > demaFast[1] and demaSlow < demaFast;
def demaCrossingOverGoingUp = demaSlow < demaFast and demaSlow[-1] > demaFast[-1];

def HARed = HAOpen > HAclose;
def HAGreen = !HARed;
def HADecidedRed = HARed and HAHigh == HAopen;
def HADecidedGreen = HAGreen and HAlow == HAOpen;

def sell = demaCrossingOverGoingDown and (HADecidedRed or HADecidedRed[1] or HADecidedRed[2]);

def buy = demaCrossingOverGoingUp and (HADecidedGreen or HADecidedGreen[1] or HADecidedGreen[2]);

AddOrder(OrderType.SELL_AUTO, sell equals 1, open, 100, Color.RED, Color.RED, "Sell @" + open);
AddOrder(OrderType.BUY_AUTO, buy equals 1, open, 100, Color.GREEN, Color.GREEN, "Buy @" + open);

@threelderwand

Why did you write the code this way for the up signal if you don't mind me asking?

def demaCrossingOverGoingUp = demaSlow < demaFast and demaSlow[-1] > demaFast[-1];
 

Attachments

  • wLa2tbp.png
    wLa2tbp.png
    148.3 KB · Views: 264
Please use the DEMA_HA code with caution - the way it is built gives an advantage in the back-test that is very difficult to repeat in live trading. The three lines of code that cause an issue in my view are:

def demaCrossingOverGoingUp = demaSlow < demaFast and demaSlow[-1] > demaFast[-1];

AddOrder(OrderType.SELL_AUTO, sell equals 1, open, 100, Color.RED, Color.RED, "Sell @" + open);
AddOrder(OrderType.BUY_AUTO, buy equals 1, open, 100, Color.GREEN, Color.GREEN, "Buy @" + open);

I tested with 8 tick Range Bars with over 5000 trades and then did an Out of Sample test. With this code I could not repeat the back-test results because many of the entries could not be made as signaled with this code.

Made a few changes in the code.

def demaSlow = DEMA(close, 8);#8
def demaFast = DEMA(close, 21);#21
plot demaFastlt = DEMA(close, 50);#50
demaFastlt.SetLineWeight(2);
plot demaFastvlt = DEMA(close, 200);#200
demaFastvlt.SetLineWeight(4);

def HAclose = ohlc4;
def HAopen = CompoundValue(1,(HAopen[1] + HAclose[1]) / 2,
(open[1] + close[1]) / 2);
def HAhigh = Max(Max(high, HAopen), HAclose);
def HAlow = Min(Min(low, HAopen), HAclose);

def demaCrossingOverGoingDown = demaSlow[1] > demaFast[1] and demaSlow < demaFast;
def demaCrossingOverGoingUp = demaSlow < demaFast and demaSlow[-1] > demaFast[-1];

def HARed = HAOpen > HAclose;
def HAGreen = !HARed;
def HADecidedRed = HARed and HAHigh == HAopen;
def HADecidedGreen = HAGreen and HAlow == HAOpen;

######################################################################################
######################################################################################

#def sellsignal = demaCrossingOverGoingDown and (HADecidedRed or HADecidedRed[1] or HADecidedRed[2]);
def sellsignal = demaCrossingOverGoingDown and close < demaFastlt and (HADecidedRed or HADecidedRed[1] or HADecidedRed[2]);

#def buysignal = demaCrossingOverGoingUp and (HADecidedGreen or HADecidedGreen[1] or HADecidedGreen[2]);
def buysignal = demaCrossingOverGoingUp and close > demaFastlt and (HADecidedGreen or HADecidedGreen[1] or HADecidedGreen[2]);

#When testing need to turn the comment "" off
AddOrder(OrderType.SELL_AUTO, sellsignal equals 1, close, 1, Color.RED, Color.RED, "DEMA Sell @" + close);
AddOrder(OrderType.BUY_AUTO, buysignal equals 1, close[-1], 1, Color.GREEN, Color.GREEN, "DEMA Buy @" + close);

#AddVerticalLine(close crosses demaFastvlt, close, Color.yellow, Curve.SHORT_DASH);
#AddVerticalLine(buysignal, close, Color.GREEN, Curve.SHORT_DASH);

AddChartBubble(demaCrossingOverGoingUp, low,"DEMA HA",Color.dark_green);
AddChartBubble(demaCrossingOverGoingDown, high,"DEMA HA",Color.dark_red);

#Alert
def alerttrigger1 = buysignal;
def alerttrigger2 = sellsignal;

input alerttext1 = " ++++++++++ DEMA + HA +++++++++++ ";
input alerttext2 = " ---------- DEMA - HA ---------- ";
input UseAlerts = {false, default true};
input AlertType = {default "BAR", "ONCE", "TICK"};

def at = AlertType;

input AlertSound = {"Chimes", "Bell", default "Ring", "NoSound", "Ding"};

Alert (alerttrigger1 and UseAlerts, alerttext1, if at == 1 then Alert.ONCE else if at == 2 then Alert.TICK else Alert.BAR, AlertSound);

Alert (alerttrigger2 and UseAlerts, alerttext2, if at == 1 then Alert.ONCE else if at == 2 then Alert.TICK else Alert.BAR, AlertSound);
 
Last edited:
Built up this DEMA Crossover strategy with Heikin-Ashi candle confirmation. Works best in Daily setup.

wLa2tbp.png


In some live trades at this time will check this afternoon.
Hello,
I applied this strategy, but screen did not change. no buy or sell signals
def demaSlow = DEMA(close, 8);
def demaFast = DEMA(close, 21);

def HAclose = ohlc4;
def HAopen = CompoundValue(1,(HAopen[1] + HAclose[1]) / 2,
(open[1] + close[1]) / 2);
def HAhigh = Max(Max(high, HAopen), HAclose);
def HAlow = Min(Min(low, HAopen), HAclose);

def demaCrossingOverGoingDown = demaSlow[1] > demaFast[1] and demaSlow < demaFast;
def demaCrossingOverGoingUp = demaSlow < demaFast and demaSlow[-1] > demaFast[-1];

def HARed = HAOpen > HAclose;
def HAGreen = !HARed;
def HADecidedRed = HARed and HAHigh == HAopen;
def HADecidedGreen = HAGreen and HAlow == HAOpen;

def sell = demaCrossingOverGoingDown and (HADecidedRed or HADecidedRed[1] or HADecidedRed[2]);

def buy = demaCrossingOverGoingUp and (HADecidedGreen or HADecidedGreen[1] or HADecidedGreen[2]);

AddOrder(OrderType.SELL_AUTO, sell equals 1, open, 100, Color.RED, Color.RED, "Sell @" + open);
AddOrder(OrderType.BUY_AUTO, buy equals 1, open, 100, Color.GREEN, Color.GREEN, "Buy @" + open);
[/code]
Built up this DEMA Crossover strategy with Heikin-Ashi candle confirmation. Works best in Daily setup.

wLa2tbp.png


ThinkScript Code

Rich (BB code):
def demaSlow = DEMA(close, 8);
def demaFast = DEMA(close, 21);

def HAclose = ohlc4;
def HAopen = CompoundValue(1,(HAopen[1] + HAclose[1]) / 2,
(open[1] + close[1]) / 2);
def HAhigh = Max(Max(high, HAopen), HAclose);
def HAlow = Min(Min(low, HAopen), HAclose);

def demaCrossingOverGoingDown = demaSlow[1] > demaFast[1] and demaSlow < demaFast;
def demaCrossingOverGoingUp = demaSlow < demaFast and demaSlow[-1] > demaFast[-1];

def HARed = HAOpen > HAclose;
def HAGreen = !HARed;
def HADecidedRed = HARed and HAHigh == HAopen;
def HADecidedGreen = HAGreen and HAlow == HAOpen;

def sell = demaCrossingOverGoingDown and (HADecidedRed or HADecidedRed[1] or HADecidedRed[2]);

def buy = demaCrossingOverGoingUp and (HADecidedGreen or HADecidedGreen[1] or HADecidedGreen[2]);

AddOrder(OrderType.SELL_AUTO, sell equals 1, open, 100, Color.RED, Color.RED, "Sell @" + open);
AddOrder(OrderType.BUY_AUTO, buy equals 1, open, 100, Color.GREEN, Color.GREEN, "Buy @" + open);
Hello
this did not work for me at all - what am I doing wrong?
 

Attachments

  • wLa2tbp.png
    wLa2tbp.png
    148.3 KB · Views: 247
  • wLa2tbp.png
    wLa2tbp.png
    148.3 KB · Views: 248

Not the exact question you're looking for?

Start a new thread and receive assistance from our community.

87k+ Posts
292 Online
Create Post

The Market Trading Game Changer

Join 2,500+ subscribers inside the useThinkScript VIP Membership Club
  • Exclusive indicators
  • Proven strategies & setups
  • Private Discord community
  • ‘Buy The Dip’ signal alerts
  • Exclusive members-only content
  • Add-ons and resources
  • 1 full year of unlimited support

Frequently Asked Questions

What is useThinkScript?

useThinkScript is the #1 community of stock market investors using indicators and other tools to power their trading strategies. Traders of all skill levels use our forums to learn about scripting and indicators, help each other, and discover new ways to gain an edge in the markets.

How do I get started?

We get it. Our forum can be intimidating, if not overwhelming. With thousands of topics, tens of thousands of posts, our community has created an incredibly deep knowledge base for stock traders. No one can ever exhaust every resource provided on our site.

If you are new, or just looking for guidance, here are some helpful links to get you started.

What are the benefits of VIP Membership?
VIP members get exclusive access to these proven and tested premium indicators: Buy the Dip, Advanced Market Moves 2.0, Take Profit, and Volatility Trading Range. In addition, VIP members get access to over 50 VIP-only custom indicators, add-ons, and strategies, private VIP-only forums, private Discord channel to discuss trades and strategies in real-time, customer support, trade alerts, and much more. Learn all about VIP membership here.
How can I access the premium indicators?
To access the premium indicators, which are plug and play ready, sign up for VIP membership here.
Back
Top