
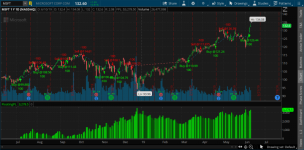
Built up this DEMA Crossover strategy with Heikin-Ashi candle confirmation. Works best in Daily setup.

ThinkScript Code
Rich (BB code):
def demaSlow = DEMA(close, 8);
def demaFast = DEMA(close, 21);

def HAclose = ohlc4;
def HAopen = CompoundValue(1,(HAopen[1] + HAclose[1]) / 2,
(open[1] + close[1]) / 2);
def HAhigh = Max(Max(high, HAopen), HAclose);
def HAlow = Min(Min(low, HAopen), HAclose);

def demaCrossingOverGoingDown = demaSlow[1] > demaFast[1] and demaSlow < demaFast;
def demaCrossingOverGoingUp = demaSlow < demaFast and demaSlow[-1] > demaFast[-1];

def HARed = HAOpen > HAclose;
def HAGreen = !HARed;
def HADecidedRed = HARed and HAHigh == HAopen;
def HADecidedGreen = HAGreen and HAlow == HAOpen;

def sell = demaCrossingOverGoingDown and (HADecidedRed or HADecidedRed[1] or HADecidedRed[2]);

def buy = demaCrossingOverGoingUp and (HADecidedGreen or HADecidedGreen[1] or HADecidedGreen[2]);

AddOrder(OrderType.SELL_AUTO, sell equals 1, open, 100, Color.RED, Color.RED, "Sell @" + open);
AddOrder(OrderType.BUY_AUTO, buy equals 1, open, 100, Color.GREEN, Color.GREEN, "Buy @" + open);
Attachments
Last edited by a moderator:


