Days Until Earnings Watchlist for ThinkorSwim

tomsk

Well-known member
VIP
Here is a Days to Earnings Watchlist that I have been using for years.
Hope this helps someone

Code:
# TDE - Trading days til earnings
# Displays the trading days til earnings. after-market earnings add 0.5 to the count.
# This code is meant to be pasted into a custom watchlist column
#
# Author: Allen Everhart
# Date: Oct 8, 2013
# Rev 1.3: Oct 19, 2014 code code watchlist column
# Rev 1.2: Mar 8, 2014 color code the after-market earnings.
# Rev 1.1: Oct 22, 2013 add 0.5 if earnings are after-market.

input length=60;
def xx = -getEventOffset(Events.EARNINGS);
def yy = sum(HasEarnings(type = EarningTime.AFTER_MARKET),length)[-length +1] > 0;
plot x=xx+yy*.5;
AssignBackgroundColor( if x < 8 then Color.RED else Color.BLUE);
 
@markos I have tested probably well over a dozen different such watchlists. That one I posted is the one I use and is the best in my opinion. Glad you have it too
 
Here is the one I use, it has proven to be very good.

OOaP8uK.png


Code:
# +--------------------------------------------------+


# |          Highlight days around earnings          |
# |                   Robert Payne                   |
# |           http://rrpayne.blogspot.com            |
# +--------------------------------------------------+
input daysBefore = 10;
input daysAfter = 10;

input showLines = yes;
input paintBackground = yes;

DefineGlobalColor("Before Earnings", Color.YELLOW);
DefineGlobalColor("Earnings Release Date", Color.YELLOW);
DefineGlobalColor("After Earnings", Color.CYAN);
DefineGlobalColor("Fill Before", CreateColor(178, 216, 166));
DefineGlobalColor("Fill After", CreateColor(131, 191, 213));

AddVerticalLine(showLines and HasEarnings()[-daysBefore], Concat(daysBefore, " Days Before" ), GlobalColor("Before Earnings" ), Curve.FIRM);
AddVerticalLine(showLines and HasEarnings(), "Earnings!", GlobalColor("Earnings Release Date" ), Curve.FIRM);
AddVerticalLine(showLines and HasEarnings()[daysAfter], Concat(daysAfter, " Days After" ), GlobalColor("After Earnings" ), Curve.FIRM);

def before = Sum(HasEarnings(), daysBefore)[-daysBefore];
def after = Sum(HasEarnings(), daysAfter)[1];

def value1 = Double.Positive_Infinity;
def value2 = if paintBackground and before then Double.Negative_Infinity else Double.NaN;
def value3 = if paintBackground and after  then Double.Negative_Infinity else Double.NaN;

AddCloud(value1, value2, GlobalColor("Fill Before" ));
AddCloud(value1, value3, GlobalColor("Fill After" ));
 
Here is a Days to Earnings Watchlist that I have been using for years.
Hope this helps someone

Code:
# TDE - Trading days til earnings
# Displays the trading days til earnings. after-market earnings add 0.5 to the count.
# This code is meant to be pasted into a custom watchlist column
#
# Author: Allen Everhart
# Date: Oct 8, 2013
# Rev 1.3: Oct 19, 2014 code code watchlist column
# Rev 1.2: Mar 8, 2014 color code the after-market earnings.
# Rev 1.1: Oct 22, 2013 add 0.5 if earnings are after-market.

input length=60;
def xx = -getEventOffset(Events.EARNINGS);
def yy = sum(HasEarnings(type = EarningTime.AFTER_MARKET),length)[-length +1] > 0;
plot x=xx+yy*.5;
AssignBackgroundColor( if x < 8 then Color.RED else Color.BLUE);
Anybody know how to modify this script so that we can sort the earning release date? So that we can know how many days is the earning is coming up. Thanks
 
This is a suggestion to get around the sort problem until one is provided or found. On your Scan window, select 'Export to Excel' off the menu. Then, open an Excel worksheet and paste the data off the clipboard. Add titles and filters to the Excel columns. You can sort any pasted column using any of the added filters. The problem sorting the watchlist's earnings column is date is shown as MM/DD/YY, contains numbers of days just before the date. The format for sorting should be YYYY/MM/DD followed by number of days. The study should be enhanced to provide the capability of selecting either one of the formats (MM/DD/YYYYY or YYYY/MM/DD). Hope this helps...
 
Last edited:
This is a suggestion to get around the sort problem until one is provided or found. On your Scan window, select 'Export to Excel' off the menu. Then, open an Excel worksheet and paste the data off the clipboard. Add titles and filters to the Excel columns. You can sort any pasted column using any of the added filters. The problem sorting the watchlist's earnings column is date is shown as MM/DD/YY, contains numbers of days just before the date. The format for sorting should be YYYY/MM/DD followed by number of days. The study should be enhanced to provide the capability of selecting either one of the formats (MM/DD/YYYYY or YYYY/MM/DD). Hope this helps...
I have absolutely no problem sorting for earnings using the study in post #1. Do you really need the date? I just want to know if its coming up. 5 means 5 trading days away. Don't make it more dificult than that. BTW, there may be one written in the One Note located in Tutorials. It's updated every day.
 
Hi guys,
im trying to create a script, for my watchlist, in which if the days to earnings is less than 5 it is assigned with a dark red color.
But i don't understand why it doesn't work...

thank you all in advance for your help

plot daystoeranings =AbsValue(GetEventOffset("eventType" = Events.EARNINGS));

assignBackgroundColor(if daystoeranings<=5 then color.dark_red else color.currrent);

when i am stuck on a code, i add bubbles to display variable values, to see what is happening. if it is a column or a scan code, for debugging, i would make it a lower chart study.

Code:
declare lower;
def daystoearnings =AbsValue(GetEventOffset("eventType" = Events.EARNINGS));

addchartbubble(1, 0, barnumber() + "\n" + daystoearnings, color.yellow, yes);

# a reference line. bubbles may not appear if no lines.
plot z = 0;

my guess is earnings data only happens 4x a year. the other bars will be na or 0.

https://tlc.thinkorswim.com/center/reference/thinkScript/Functions/Corporate-Actions

this might help
https://funwiththinkscript.com/highlighting-the-period-around-earnings/
 
Here is a Days to Earnings Watchlist that I have been using for years.
Hope this helps someone

Code:
# TDE - Trading days til earnings
# Displays the trading days til earnings. after-market earnings add 0.5 to the count.
# This code is meant to be pasted into a custom watchlist column
#
# Author: Allen Everhart
# Date: Oct 8, 2013
# Rev 1.3: Oct 19, 2014 code code watchlist column
# Rev 1.2: Mar 8, 2014 color code the after-market earnings.
# Rev 1.1: Oct 22, 2013 add 0.5 if earnings are after-market.

input length=60;
def xx = -getEventOffset(Events.EARNINGS);
def yy = sum(HasEarnings(type = EarningTime.AFTER_MARKET),length)[-length +1] > 0;
plot x=xx+yy*.5;
AssignBackgroundColor( if x < 8 then Color.RED else Color.BLUE);
Hi, thanks for sharing this great script! One question: Do I understand correctly that BMO vs AMC should be color-coded? I love the idea of that, though when I brought the code into TOS there are no color distinctions on the watchlist.
 
Hi, thanks for sharing this great script! One question: Do I understand correctly that BMO vs AMC should be color-coded? I love the idea of that, though when I brought the code into TOS there are no color distinctions on the watchlist.

I'm having the same issue. No color even when it is less than 8 days. Would really like a solution asap.

Thanks!

Ryan
 
Hi I was trying to create a script that would show how many days until the earnings like if it will be in 1 day or 2 or 3 or 4 etc...
but for some reason I only get 1...is there someone here that could help me with that?

def earnings = if hasEarnings() == 0 then 1 else 0;
def sumEanings = Sum(earnings, 10);

AddLabel (earnings, +sumEanings, color.white);
AddLabel (!earnings, " ", color.black);

AssignBackgroundColor (if earnings then color.red else color.black);
 
Hi, thanks for sharing this great script! One question: Do I understand correctly that BMO vs AMC should be color-coded? I love the idea of that, though when I brought the code into TOS there are no color distinctions on the watchlist.
I'm having the same issue. No color even when it is less than 8 days. Would really like a solution asap.

Thanks!

Ryan
@Ismelloa

The code in the top post WILL NOT change color in a watchlist. There is NO workaround. If you want to understand why, you could call support and come back and explain it to the rest of us.

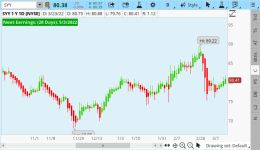
The function GetEventOffset("eventType" = Events.EARNINGS) will change color in a label. In the below example, it changes color when Next Earnings Date is more than 30 days away.

The fact that it works in a label but not a watchlist column would make me hazard a guess that the expansion area of 44 that is necessary to make the code work as a label is not available in the parameters of the watchlist column function. FYI, this would also mean this function is not available for manipulation in the scan hacker or conditional orders.
fGxUoBn.png
xm0s1qL.png

My label code:
Ruby:
# Next Earnings Date
# Paris
# 10.15.2019

## IMPORTANT!!!! 44 EXPANSION You have to have enough expansion area on your chart available to reach the actual Earnings date, so if you have 0 expansion area, an inconsistent date will be displayed

#HINT: watchlist label that shows days-to-earnings and next earnings date (if next earnings date is available).  Includes a visual alert if "EARNINGS TODAY"

#def allows you to teach ThinkScript new "words" to save time and typing by using your new "words" later in the code
def bn = BarNumber();
def na = Double.NaN;
def getNextEarnings = AbsValue(GetEventOffset(Events.EARNINGS, 0));
def findDay = GetDayOfMonth(GetYYYYMMDD());
def findMonth = GetMonth();
def findYear = GetYear();

#ThinkScript thinks in numbers, including converting dates into numbers and viewing each bar on the chart as a number.  Therefore, you can use BarNumber to tell ThinkScript which bar, and use lines in ThinkScript code to 'trick' ThinkScript into displaying that daily bar in date format
def getNextEarningsBarNumber = if !isNaN(getNextEarnings) then bn + getNextEarnings else na;
def NextEarnings = bn == HighestAll(getNextEarningsBarNumber);
def getNextEarningsMonth = HighestAll(if NextEarnings then findMonth else na);
def getNextEarningsDay = HighestAll(if NextEarnings then findDay else na);
def getNextEarningsYear = HighestAll(if NextEarnings then findYear else na);

#plot tells ThinkScript what data you want displayed.  Hide() is used in this case because desired display is the label and not the numberic equivalent of the data
plot DaysToEarnings = getNextEarningsBarNumber;
DaysToEarnings.Hide();

DefineGlobalColor("Pre_Cyan", CreateColor(50, 200, 255)) ;
DefineGlobalColor("LabelRed",  CreateColor(225, 0, 0)) ;
DefineGlobalColor("LabelGreen",  CreateColor(0, 165, 0)) ;
DefineGlobalColor("LabelRed",  CreateColor(225, 0, 0)) ;
DefineGlobalColor("Label2Green",  CreateColor(0, 200, 0)) ;
DefineGlobalColor("Violet", CreateColor (200, 125, 255)) ;
AddLabel(getNextEarnings > 0, "Next Earnings: (" + getNextEarnings + (if getNextEarnings == 1 then " Day): " else " Days): ") + getNextEarningsMonth + "/" + getNextEarningsDay + "/" + AsPrice(getNextEarningsYear),
if getNextEarnings > 30 then GlobalColor("Violet") else GlobalColor("LabelGreen"));
AddLabel(getNextEarnings == 0, "  EARNINGS TODAY ", GlobalColor("Pre_Cyan"));
# End Next Earnings Date
 

Attachments

  • fGxUoBn.png
    fGxUoBn.png
    37.6 KB · Views: 977
Last edited:
You can use this code as a workaround for the background color.

# TDE - Trading days til earnings
# Displays the trading days til earnings. after-market earnings add 0.5 to the count.
# This code is meant to be pasted into a custom watchlist column
#
# Author: Allen Everhart
# Date: Oct 8, 2013
# Rev 1.3: Oct 19, 2014 code code watchlist column
# Rev 1.2: Mar 8, 2014 color code the after-market earnings.
# Rev 1.1: Oct 22, 2013 add 0.5 if earnings are after-market.

input length=60;
def xx = -getEventOffset(Events.EARNINGS);
def yy = sum(HasEarnings(type = EarningTime.AFTER_MARKET),length)[-length +1] > 0;
plot x=xx+yy*.5;

x.assignValueColor(if xx <= 8 then Color.DARK_RED else Color.BLUE);
 

Join useThinkScript to post your question to a community of 21,000+ developers and traders.

Similar threads

Not the exact question you're looking for?

Start a new thread and receive assistance from our community.

87k+ Posts
372 Online
Create Post

Similar threads

Similar threads

The Market Trading Game Changer

Join 2,500+ subscribers inside the useThinkScript VIP Membership Club
  • Exclusive indicators
  • Proven strategies & setups
  • Private Discord community
  • ‘Buy The Dip’ signal alerts
  • Exclusive members-only content
  • Add-ons and resources
  • 1 full year of unlimited support

Frequently Asked Questions

What is useThinkScript?

useThinkScript is the #1 community of stock market investors using indicators and other tools to power their trading strategies. Traders of all skill levels use our forums to learn about scripting and indicators, help each other, and discover new ways to gain an edge in the markets.

How do I get started?

We get it. Our forum can be intimidating, if not overwhelming. With thousands of topics, tens of thousands of posts, our community has created an incredibly deep knowledge base for stock traders. No one can ever exhaust every resource provided on our site.

If you are new, or just looking for guidance, here are some helpful links to get you started.

What are the benefits of VIP Membership?
VIP members get exclusive access to these proven and tested premium indicators: Buy the Dip, Advanced Market Moves 2.0, Take Profit, and Volatility Trading Range. In addition, VIP members get access to over 50 VIP-only custom indicators, add-ons, and strategies, private VIP-only forums, private Discord channel to discuss trades and strategies in real-time, customer support, trade alerts, and much more. Learn all about VIP membership here.
How can I access the premium indicators?
To access the premium indicators, which are plug and play ready, sign up for VIP membership here.
Back
Top