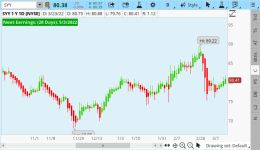
Here is a Days to Earnings Watchlist that I have been using for years.
Hope this helps someone
Hope this helps someone
Code:
# TDE - Trading days til earnings
# Displays the trading days til earnings. after-market earnings add 0.5 to the count.
# This code is meant to be pasted into a custom watchlist column
#
# Author: Allen Everhart
# Date: Oct 8, 2013
# Rev 1.3: Oct 19, 2014 code code watchlist column
# Rev 1.2: Mar 8, 2014 color code the after-market earnings.
# Rev 1.1: Oct 22, 2013 add 0.5 if earnings are after-market.

input length=60;
def xx = -getEventOffset(Events.EARNINGS);
def yy = sum(HasEarnings(type = EarningTime.AFTER_MARKET),length)[-length +1] > 0;
plot x=xx+yy*.5;
AssignBackgroundColor( if x < 8 then Color.RED else Color.BLUE);