Bingy
Member
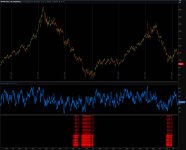
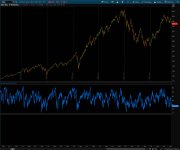
The following Indicator pairs well with a standard RSI indicator to pinpoint short and long entries on the Daily Time Frame for stocks. It's a freebie to give back to the community here. The Threshold's in relation to "DLength" can be tuned to work on lower Time Frames as well. Enjoy...
Code:
declare lower;
#DISCOUNT INDICATOR
# Define input parameters
input Dprice = close;
input Dlength = 2000;
input premiumThreshold = 2.315; # Premium threshold
input discountThreshold = 0.6861; # Discount threshold
# Calculate the moving average
def smaValue = SimpleMovingAvg(Dprice, Dlength);
# Calculate the premium and discount levels
def isPremium = Dprice > smaValue * premiumThreshold;
def isDiscount = Dprice < smaValue * discountThreshold;
# Manually draw lines
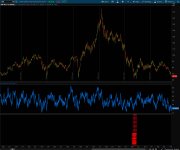
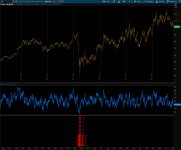
AddVerticalLine(isPremium, "Search for Short", Color.GREEN);
AddVerticalLine(isDiscount, "Search for Long", Color.RED);