Customised labels in watchlist

8Nick8

Active member
2019 Donor
VIP
11351[/ATTACH]']
vpQlhIs.jpg

Hi, I am planning to create a customised watchlist that plots the positions of the moving average with the help of labels
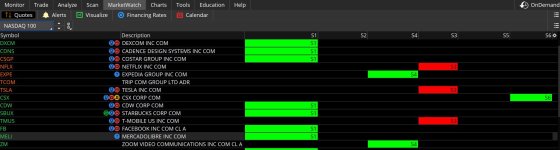
Currently, i have to spilt this script into 6 different plots so that it can assign a label with color when the conditions are met as show in the pic
I tried to insert the entire script in the custom code formula, but ONLY 1 plot will be shown

Can i request assistance to help me edit the script so that it will automatically assign each box with the right label whenever the conditions are met

Plot Trend1 = MovAvgExponential(close, 13);
Trend1.AssignValueColor(if close > Trend1 then Color.GREEN else Color.RED);
Trend1.SetLineWeight(1);
Plot Trend2 = MovAvgExponential(close, 34);
Trend2.AssignValueColor(if close > Trend2 then Color.GREEN else Color.RED);
Trend2.SetLineWeight(2);

plot L1 = close >trend1 and trend1>trend2;
addlabel(yes, if L1 >=1.0 then "S1" else "",color.black);
assignbackgroundcolor(if L1 >=1.0 then color.green else color.black);

plot L2 = close <trend1 and close>trend2 and trend1>trend2;
assignbackgroundcolor(if L2 >=1.0 then color.green else color.black);

plot L3 = close<trend2 and trend1>trend2;
addlabel(yes, if L3 >=1.0 then "S3" else "",color.black);
assignbackgroundcolor(if L3 >=1.0 then color.red else color.black);

plot L4= close < Trend1 and Trend1< trend2;
addlabel(yes, if l4 >=1.0 then "S4" else "",color.black);
assignbackgroundcolor(if l4 >=1.0 then color.green else color.black);

plot L5 = close > Trend1 and close<trend2 and Trend2 > Trend1;
addlabel(yes, if L5 >=1.0 then "S5" else "",color.black);
assignbackgroundcolor(if L5 >=1.0 then color.green else color.black);

plot L6 = close > Trend1 and close > trend2 and trend2> trend1;
addlabel(yes, if L6 >=1.0 then "S6" else "",color.black);
assignbackgroundcolor(if L6 >=1.0 then color.green else color.black);

Thank you
 

Attachments

  • vpQlhIs.jpg
    vpQlhIs.jpg
    108.1 KB · Views: 55
column study

zcompare_avg
http://tos.mx/tT0SwJS

this combines several average comparing conditions into 1 plot and 1 backcolor
a column study can have only (1 plot or 1 addlabel) and only 1 assignbackgroundcolor().

i started with your code and copied 1 line at a time and rewrote it or added it into another code line.
changed all the plots to be def.
copied the text condition logic and added them to the addlabel().
copied the color condition logic and added them to the assignbackgroundcolor()

this checks the green color conditions first, then the red. if it is possible for more than 1 condition to be true, you will have to decide which condition is more important and rearrange the sequence of the conditions in the addlabel() and the assignbackgroundcolor(), to display the desired output.

Ruby:
# zcompare_avg
def trend1 = MovAvgExponential(close, 13);
def trend2 = MovAvgExponential(close, 34);

#def up = (close > trend1 or close > trend2);

def L1 = close > trend1 and trend1 > trend2;
def L2 = close < trend1 and close > trend2 and trend1 > trend2;

def L3 = close < trend2 and trend1 > trend2;
def L4 = close < trend1 and trend1 < trend2;

def L5 = close > trend1 and close < trend2 and trend2 > trend1;
def L6 = close > trend1 and close > trend2 and trend2 > trend1;

# -------------------------------------

addlabel(yes,
      if L1 then "S1"
 else if L3 then "S3"
 else if L4 then "S4"
 else if L5 then "S5"
 else if L6 then "S6"
 else ""
,color.black);

# -----------------------------------
# color
assignbackgroundcolor(
 if ((close > trend1) or (close > trend2) or L1 or L2 or L4 or L5 or L6) then Color.GREEN
 else if ((close < trend1) or (close < trend2) or L3) then color.red
 else Color.current);
 

Join useThinkScript to post your question to a community of 21,000+ developers and traders.

column study

zcompare_avg
http://tos.mx/tT0SwJS

this combines several average comparing conditions into 1 plot and 1 backcolor
a column study can have only (1 plot or 1 addlabel) and only 1 assignbackgroundcolor().

i started with your code and copied 1 line at a time and rewrote it or added it into another code line.
changed all the plots to be def.
copied the text condition logic and added them to the addlabel().
copied the color condition logic and added them to the assignbackgroundcolor()

this checks the green color conditions first, then the red. if it is possible for more than 1 condition to be true, you will have to decide which condition is more important and rearrange the sequence of the conditions in the addlabel() and the assignbackgroundcolor(), to display the desired output.

Ruby:
# zcompare_avg
def trend1 = MovAvgExponential(close, 13);
def trend2 = MovAvgExponential(close, 34);

#def up = (close > trend1 or close > trend2);

def L1 = close > trend1 and trend1 > trend2;
def L2 = close < trend1 and close > trend2 and trend1 > trend2;

def L3 = close < trend2 and trend1 > trend2;
def L4 = close < trend1 and trend1 < trend2;

def L5 = close > trend1 and close < trend2 and trend2 > trend1;
def L6 = close > trend1 and close > trend2 and trend2 > trend1;

# -------------------------------------

addlabel(yes,
      if L1 then "S1"
 else if L3 then "S3"
 else if L4 then "S4"
 else if L5 then "S5"
 else if L6 then "S6"
 else ""
,color.black);

# -----------------------------------
# color
assignbackgroundcolor(
 if ((close > trend1) or (close > trend2) or L1 or L2 or L4 or L5 or L6) then Color.GREEN
 else if ((close < trend1) or (close < trend2) or L3) then color.red
 else Color.current);
@halcyonguy thank u very much for the detailed explanation. Greatly appreciated. I added one new condition, highlighted in BOLD L4x to assign the box to be white and label as S4x. I also tried to rearrange the sequence of the color but the display still appear in Green n S4. There is no error msg, can i request your assistance to take a look what did i not do correctly. Thank u

# zcompare_avg
def trend1 = MovAvgExponential(close, 13);
def trend2 = MovAvgExponential(close, 34);
def trend3 = MovAvgExponential(close, 5);

#def up = (close > trend1 or close > trend2);

def L1 = close > trend1 and trend1 > trend2;
def L2 = close < trend1 and close > trend2 and trend1 > trend2;

def L3 = close < trend2 and trend1 > trend2;
def L4 = close < trend1 and trend1 < trend2;
def L4x= close < Trend1 and Trend1< trend2 and close > trend3;# if this is true, assign background to be white color with S4x

def L5 = close > trend1 and close < trend2 and trend2 > trend1;
def L6 = close > trend1 and close > trend2 and trend2 > trend1;

# -------------------------------------

addlabel(yes,
if L1 then "S1"
else if L2 then "S2"# this was missing in the plot, so i added in
else if L3 then "S3"
else if L4 then "S4"
else if L4x then S4x"
else if L5 then "S5"
else if L6 then "S6"
else ""
,color.black);

# -----------------------------------
# color
assignbackgroundcolor(
if ((close > trend1) or (close > trend2) or L1 or L2 or L4 or L5 or L6) then Color.GREEN
else if ((close < trend1) or (close < trend2) or L3) then color.red
else if ((close < trend1) or (close < trend2) or (close > trend3) or L4x) then color. white
else Color.current);
i made a lower study for debugging.

looking at a couple stocks,
when ever L4x is true, L4 is also true, so the L4 in green color is acted on first, and the logic never gets to L4x.
you will have to rearrange and rethink your conditions to come up with a unique rule for L4x.

sometimes i make a lower study, to display variable values, to help me debug an issue. it can be frustrating to try to fix code in a column.

i copied your code from post #3 and made it a lower study, and added some bubbles to display values.
with this, you can look at one stock , at various times and verify valid data is shown.

Ruby:
# test_compareavg02
# col - zcompare2

declare lower;

# zcompare_avg
def trend1 = MovAvgExponential(close, 13);
def trend2 = MovAvgExponential(close, 34);
def trend3 = MovAvgExponential(close, 5);

#def up = (close > trend1 or close > trend2);

def L1 = close > trend1 and trend1 > trend2;
def L2 = close < trend1 and close > trend2 and trend1 > trend2;

def L3 = close < trend2 and trend1 > trend2;
def L4 = close < trend1 and trend1 < trend2;
def L4x = close < Trend1 and Trend1 < trend2 and close > trend3;
#  if L$x is true, assign background to be white color with S4x

def L5 = close > trend1 and close < trend2 and trend2 > trend1;
def L6 = close > trend1 and close > trend2 and trend2 > trend1;

#  s2  was missing in the plot, so i added in
addlabel(yes,
if L1 then "S1"
else if L2 then "S2"
else if L3 then "S3"
else if L4 then "S4"
else if L4x then "S4x"
else if L5 then "S5"
else if L6 then "S6"
else ""
,color.cyan);
#,color.black);

# -----------------------------------
# color
#assignbackgroundcolor(
#if ((close > trend1) or (close > trend2) or L1 or L2 or L4 or L5 or L6) then Color.GREEN
#else if ((close < trend1) or (close < trend2) or L3) then color.red
#else if ((close < trend1) or (close < trend2) or (close > trend3) or L4x) then color. white
#else Color.current);


# -------------------------------------

# display some values
plot t1 = 3.5;
plot z = 0;
plot t2= -3.5;
def draw = !isnan(close);


#  test L4 values
addlabel(1, " top bubbles are L4", color.yellow);
plot w = (L4 * 0.5 ) + 0.25;
z.SetDefaultColor(Color.yellow);
#def L4 = close < trend1 and trend1 < trend2;
addchartbubble(draw, 1, L4 + "\n" + (close < trend1) + "\n" + (trend1 < trend2) , if l4 then color.yellow else color.cyan, yes);


#  test L4x values
addlabel(1, " bottom bubble are L4x", color.yellow);
plot x = (L4x * 0.5) - 0.75;
x.SetDefaultColor(Color.magenta);
# def L4x = close < Trend1 and Trend1 < trend2 and close > trend3;
addchartbubble(draw, -1, L4x + "\n" + (close < trend1) + "\n" + (trend1 < trend2) + "\n" + (close > trend3), if l4x then color.white else color.dark_gray, no);

#

aLI421T.jpg
 
Last edited:
i made a lower study for debugging.

looking at a couple stocks,
when ever L4x is true, L4 is also true, so the L4 in green color is acted on first, and the logic never gets to L4x.
you will have to rearrange and rethink your conditions to come up with a unique rule for L4x.

sometimes i make a lower study, to display variable values, to help me debug an issue. it can be frustrating to try to fix code in a column.

i copied your code from post #3 and made it a lower study, and added some bubbles to display values.
with this, you can look at one stock , at various times and verify valid data is shown.

Ruby:
# test_compareavg02
# col - zcompare2

declare lower;

# zcompare_avg
def trend1 = MovAvgExponential(close, 13);
def trend2 = MovAvgExponential(close, 34);
def trend3 = MovAvgExponential(close, 5);

#def up = (close > trend1 or close > trend2);

def L1 = close > trend1 and trend1 > trend2;
def L2 = close < trend1 and close > trend2 and trend1 > trend2;

def L3 = close < trend2 and trend1 > trend2;
def L4 = close < trend1 and trend1 < trend2;
def L4x = close < Trend1 and Trend1 < trend2 and close > trend3;
#  if L$x is true, assign background to be white color with S4x

def L5 = close > trend1 and close < trend2 and trend2 > trend1;
def L6 = close > trend1 and close > trend2 and trend2 > trend1;

#  s2  was missing in the plot, so i added in
addlabel(yes,
if L1 then "S1"
else if L2 then "S2"
else if L3 then "S3"
else if L4 then "S4"
else if L4x then "S4x"
else if L5 then "S5"
else if L6 then "S6"
else ""
,color.cyan);
#,color.black);

# -----------------------------------
# color
#assignbackgroundcolor(
#if ((close > trend1) or (close > trend2) or L1 or L2 or L4 or L5 or L6) then Color.GREEN
#else if ((close < trend1) or (close < trend2) or L3) then color.red
#else if ((close < trend1) or (close < trend2) or (close > trend3) or L4x) then color. white
#else Color.current);


# -------------------------------------

# display some values
plot t1 = 3.5;
plot z = 0;
plot t2= -3.5;
def draw = !isnan(close);


#  test L4 values
addlabel(1, " top bubbles are L4", color.yellow);
plot w = (L4 * 0.5 ) + 0.25;
z.SetDefaultColor(Color.yellow);
#def L4 = close < trend1 and trend1 < trend2;
addchartbubble(draw, 1, L4 + "\n" + (close < trend1) + "\n" + (trend1 < trend2) , if l4 then color.yellow else color.cyan, yes);


#  test L4x values
addlabel(1, " bottom bubble are L4x", color.yellow);
plot x = (L4x * 0.5) - 0.75;
x.SetDefaultColor(Color.magenta);
# def L4x = close < Trend1 and Trend1 < trend2 and close > trend3;
addchartbubble(draw, -1, L4x + "\n" + (close < trend1) + "\n" + (trend1 < trend2) + "\n" + (close > trend3), if l4x then color.white else color.dark_gray, no);

#

aLI421T.jpg
@halcyonguy Thank u once again for your detailed explanation!! Learning everyday!!
 

Similar threads

Not the exact question you're looking for?

Start a new thread and receive assistance from our community.

87k+ Posts
390 Online
Create Post

Similar threads

Similar threads

The Market Trading Game Changer

Join 2,500+ subscribers inside the useThinkScript VIP Membership Club
  • Exclusive indicators
  • Proven strategies & setups
  • Private Discord community
  • ‘Buy The Dip’ signal alerts
  • Exclusive members-only content
  • Add-ons and resources
  • 1 full year of unlimited support

Frequently Asked Questions

What is useThinkScript?

useThinkScript is the #1 community of stock market investors using indicators and other tools to power their trading strategies. Traders of all skill levels use our forums to learn about scripting and indicators, help each other, and discover new ways to gain an edge in the markets.

How do I get started?

We get it. Our forum can be intimidating, if not overwhelming. With thousands of topics, tens of thousands of posts, our community has created an incredibly deep knowledge base for stock traders. No one can ever exhaust every resource provided on our site.

If you are new, or just looking for guidance, here are some helpful links to get you started.

What are the benefits of VIP Membership?
VIP members get exclusive access to these proven and tested premium indicators: Buy the Dip, Advanced Market Moves 2.0, Take Profit, and Volatility Trading Range. In addition, VIP members get access to over 50 VIP-only custom indicators, add-ons, and strategies, private VIP-only forums, private Discord channel to discuss trades and strategies in real-time, customer support, trade alerts, and much more. Learn all about VIP membership here.
How can I access the premium indicators?
To access the premium indicators, which are plug and play ready, sign up for VIP membership here.
Back
Top