• Get $40 off VIP by signing up for a free account! Sign Up

Custom time line (Vertical Lines) In ThinkOrSwim

vikram

New member
VIP
Anyone know if there is such a custom time line indicator ?

I am looking for lines to highlight some key times like Premarket, 1st one hour of market, 1PM EST etc.,

I am looking for vertical lines on the following time.

All times in EST

4:20 AM
7:00 AM
8:00 AM
10:00 AM
1:00 PM

Forgot to mention, I need the lines just for current day
 
Last edited by a moderator:

Join useThinkScript to post your question to a community of 21,000+ developers and traders.

How can I draw vertical lines for specific dates that propagate back and forward? For instance, I want to plot vertical lines for anytime the dates are March 21, June 21, Sept 23, and Dec 21m for all years back and forward?
 
Code:
def Date = getyYYYMMDD();
def DrawLine =
    (GetMonth() == 3 and getdayofMonth(date) == 21) or
    (GetMonth() == 6 and getdayofMonth(date) == 21) or
    (GetMonth() == 9 and getdayofMonth(date) == 23) or
    (GetMonth() == 12 and getdayofMonth(date) == 21)
;
AddVerticalLine(DrawLine);
 
Ruby:
def DrawLine =
    getDay() == getLastDay() and
    (
        !secondsFromTime(0420) or
        !secondsFromTime(0700) or
        !secondsFromTime(0800) or
        !secondsFromTime(1000) or
        !secondsFromTime(1300)
    )
;
AddVerticalLine(DrawLine);
@Joshua How can I change vertical line color from red to white?
 
Hey Joshua,
Is there a way to add vertical lines just for the start of the week?
I'd like to separate my time frames based on the start/end of each week but not sure how i can adjust the code for that
 
def DrawLine = !secondsFromTime(0930) or !secondsFromTime(1600);
AddVerticalLine(DrawLine);
 
Do any of you have ideas for plotting economic events using lines like these?
The ToS data feeds do not have economic events data.
The ToS platform does not provide for the uploading of that information.
 
Last edited:
Ruby:
def DrawLine =
    getDay() == getLastDay() and
    (
        !secondsFromTime(0420) or
        !secondsFromTime(0700) or
        !secondsFromTime(0800) or
        !secondsFromTime(1000) or
        !secondsFromTime(1300)
    )
;
AddVerticalLine(DrawLine);
Hey. Is it possible to draw a horizontal dashed line at the opening price of each interval.
 
Ruby:
def DrawLine =
    getDay() == getLastDay() and
    (
        !secondsFromTime(0420) or
        !secondsFromTime(0700) or
        !secondsFromTime(0800) or
        !secondsFromTime(1000) or
        !secondsFromTime(1300)
    )
;
AddVerticalLine(DrawLine);
This would be awesome, but unfortunately it's not working for me? ;(
 
It needs to be a time based chart with candles that land on those times.

Which chart style and delineation/aggregation are you using?
 
Hey. Is it possible to draw a horizontal dashed line at the opening price of each interval.

Yeah but this question is quite old, let me know if you're still active on the forum before I go writing code for a ghost.
 
Ruby:
def DrawLine =
    getDay() == getLastDay() and
    (
        !secondsFromTime(0420) or
        !secondsFromTime(0700) or
        !secondsFromTime(0800) or
        !secondsFromTime(1000) or
        !secondsFromTime(1300)
    )
;
AddVerticalLine(DrawLine);
I've been looking for something to mark the days time with vertical lines and this is the closest I've come to it. I thought solid thin vertical lines on the hour and the smallest dash on the half hour in white and 50% opacity for the 9:30 - 4 day would be helpful. How possible would that be?
 
I've been looking for something to mark the days time with vertical lines and this is the closest I've come to it. I thought solid thin vertical lines on the hour and the smallest dash on the half hour in white and 50% opacity for the 9:30 - 4 day would be helpful. How possible would that be?

[Edit: I made a correction in def bar that should now work]
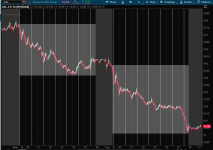
This plots verticallines on the hour and half-hour times and a cloud for the tradingzones hours.

Screenshot 2024-05-21 203909.png
Code:
#TradingZones_Verticals_Clouds
input showverticalline = yes;
input showcloud        = yes;
input begintime        = 0930;
input endtime          = 1600;
def bar         = if SecondsTillTime(begintime) == 0 and
                     SecondsFromTime(begintime) == 0
                  then 0
                  else bar[1] + 1;
def tradingzone = SecondsFromTime(begintime) >= 0  and SecondsFromTime(endtime) <= 0;

AddVerticalLine(if showverticalline and tradingzone
                then bar % ((30) / (GetAggregationPeriod() / 60000)) == 0                  else Double.NaN,
                color = Color.WHITE, stroke = Curve.FIRM);

AddVerticalLine(if showverticalline and tradingzone
                then bar % ((60) / (GetAggregationPeriod() / 60000)) == 0
                else Double.NaN,
                color = Color.WHITE, stroke = Curve.POINTS);

AddCloud(if !showcloud or !tradingzone then Double.NaN else high(period = AggregationPeriod.DAY), low(period = AggregationPeriod.DAY), color1 = Color.WHITE, color2 = Color.WHITE);

#
 

Attachments

  • Screenshot 2024-05-21 143748.png
    Screenshot 2024-05-21 143748.png
    50.6 KB · Views: 77
Last edited:
[Edit: I made a correction in def bar that should now work]
This plots verticallines on the hour and half-hour times and a cloud for the tradingzones hours.
The code in the above post is now corrrect.
When I was optimizing the def bar, I made inputs for the times that I had of 0930. I used endtime (1600) for part of the definition, when both should have been begintime (0930).
 
The code in the above post is now corrrect.
When I was optimizing the def bar, I made inputs for the times that I had of 0930. I used endtime (1600) for part of the definition, when both should have been begintime (0930).
I cannot find that code in the thread. I did get to use the code and not sure if I have the updated one.
 

Similar threads

Not the exact question you're looking for?

Start a new thread and receive assistance from our community.

87k+ Posts
407 Online
Create Post

Similar threads

Similar threads

The Market Trading Game Changer

Join 2,500+ subscribers inside the useThinkScript VIP Membership Club
  • Exclusive indicators
  • Proven strategies & setups
  • Private Discord community
  • ‘Buy The Dip’ signal alerts
  • Exclusive members-only content
  • Add-ons and resources
  • 1 full year of unlimited support

Frequently Asked Questions

What is useThinkScript?

useThinkScript is the #1 community of stock market investors using indicators and other tools to power their trading strategies. Traders of all skill levels use our forums to learn about scripting and indicators, help each other, and discover new ways to gain an edge in the markets.

How do I get started?

We get it. Our forum can be intimidating, if not overwhelming. With thousands of topics, tens of thousands of posts, our community has created an incredibly deep knowledge base for stock traders. No one can ever exhaust every resource provided on our site.

If you are new, or just looking for guidance, here are some helpful links to get you started.

What are the benefits of VIP Membership?
VIP members get exclusive access to these proven and tested premium indicators: Buy the Dip, Advanced Market Moves 2.0, Take Profit, and Volatility Trading Range. In addition, VIP members get access to over 50 VIP-only custom indicators, add-ons, and strategies, private VIP-only forums, private Discord channel to discuss trades and strategies in real-time, customer support, trade alerts, and much more. Learn all about VIP membership here.
How can I access the premium indicators?
To access the premium indicators, which are plug and play ready, sign up for VIP membership here.
Back
Top