Hello!
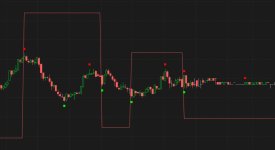
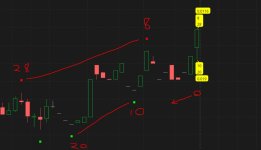
I am trying to make a scanner to help me find ascending wedge patterns on the 1 minute chart. To do so, I modified an indicator created by @halcyonguy which you can find here: https://usethinkscript.com/threads/...of-the-lines-between-peaks-and-valleys.17406/.
Below is the code for my new indicator.
Then I make a call in my scanner with the following:
However, the stocks that are returned from the scanner are really a mixed bag, so I was hoping for help on finetuning this. Thanks!
I am trying to make a scanner to help me find ascending wedge patterns on the 1 minute chart. To do so, I modified an indicator created by @halcyonguy which you can find here: https://usethinkscript.com/threads/...of-the-lines-between-peaks-and-valleys.17406/.
Below is the code for my new indicator.
Code:
#ref https://usethinkscript.com/threads/compare-2-stocks-find-divergence-of-the-slopes-of-the-lines-between-peaks-and-valleys.17406/
#modified code of halcyonguy

def na = double.nan;
def bn = barnumber();
def n = 200;

#find peaks/valleys
def op1 = open;
def hi1 = high;
def lo1 = low;
def cl1 = close;

input magnitude = 6;
def lastxbars = !isnan(getvalue(close, -(magnitude-1)));

def peak1 = hi1 > Highest(hi1[1], magnitude) and hi1 >= Highest(hi1[-magnitude], magnitude);
def valley1 = lo1 < Lowest(lo1[1], magnitude) and lo1 <= Lowest(lo1[-magnitude], magnitude);

#valley points
def y2 = 0.001;
input symbol1_peaks_valleys_dots = yes;
plot zv1 = if symbol1_peaks_valleys_dots and valley1 then lo1*(1-y2) else na;
zv1.SetPaintingStrategy(PaintingStrategy.squares);
zv1.SetDefaultColor(Color.green);
zv1.setlineweight(4);
zv1.hidebubble();

#peak points
plot zp1 = if symbol1_peaks_valleys_dots and peak1 then hi1*(1 +y2) else na;
zp1.SetPaintingStrategy(PaintingStrategy.squares);
zp1.SetDefaultColor(Color.red);
zp1.setlineweight(4);
zp1.hidebubble();

#-----------------------------
#---------- peaks ------------
# if a peak, look for next future peak

def p1nextoff;
def p1nextbn;
def p1nextpr;
def p1slope;
def p1line;
if peak1 then {
# look for offset to next peak
 p1nextoff = fold a = 1 to n
  with p = 1
  while !getvalue(peak1, -a)
  do p + 1;
 p1nextbn = bn + p1nextoff;
 p1nextpr = GetValue(hi1, -p1nextoff);
 p1slope = (p1nextpr - hi1)/p1nextoff;
 p1line = hi1;
} else {
 p1nextoff = p1nextoff[1];
 p1nextbn = p1nextbn[1];
 p1nextpr = p1nextpr[1];
 p1slope = p1slope[1];
 p1line = p1line[1] + p1slope;
}

input test_p1_line = no;
plot z1 = if test_p1_line and p1line > 0 and !isnan(cl1) and lastxbars then p1line else na;
z1.SetDefaultColor(Color.orange);
#-----------------------------
# ------ valley --------------
# if a valley, look for next future valley

def v1nextoff;
def v1nextbn;
def v1nextpr;
def v1slope;
def v1line;
if valley1 then {
# look for offset to next valley
 v1nextoff = fold b = 1 to n
  with q = 1
  while !getvalue(valley1, -b)
  do q + 1;
 v1nextbn = bn + v1nextoff;
 v1nextpr = GetValue(lo1, -v1nextoff);
 v1slope = (v1nextpr - lo1)/v1nextoff;
 v1line = lo1;
} else {
 v1nextoff = v1nextoff[1];
 v1nextbn = v1nextbn[1];
 v1nextpr = v1nextpr[1];
 v1slope = v1slope[1];
 v1line = v1line[1] + v1slope;
}

input test_v1_line = no;
plot z2 = if test_v1_line and v1line > 0 and !isnan(cl1) and lastxbars then v1line else na;
z2.SetDefaultColor(Color.orange);
Then I make a call in my scanner with the following:
Code:
plot scan = peaks_valleys()."v1slope" > peaks_valleys()."p1slope" and peaks_valleys()."v1slope" > 0;However, the stocks that are returned from the scanner are really a mixed bag, so I was hoping for help on finetuning this. Thanks!