Linear Regression For ThinkOrSwim

LLP

Member
VIP
Linear Regression is used to identify trends and potential reversals in stock prices. Here's how it works:

Trend Identification: helps determine the overall trend direction of a stock's price movement over a specific period. It provides a visual representation of whether the stock is trending upwards, downwards, or moving sideways.

Support and Resistance Levels: helps identify potential support and resistance levels. When the price approaches the regression line, it can act as a support or resistance level, indicating potential buying or selling opportunities.

Entry and Exit Zones: when the price deviates significantly from the regression line, it may signal an overbought or oversold condition, prompting traders to enter or exit positions accordingly.

ZOkpgY8.png


Hi, can someone convert this please?
https://www.tradingview.com/pine-script-docs/en/v4/essential/Drawings.html#linear-regression
 
Last edited by a moderator:
Hi, can someone convert this please?

https://www.tradingview.com/pine-script-docs/en/v4/essential/Drawings.html#linear-regression

Here is the source code of the Linear Regression tool:


//@version=5
indicator("Linear Regression", shorttitle="LinReg", overlay=true)
upperMult = input(title="Upper Deviation", defval=2)
lowerMult = input(title="Lower Deviation", defval=-2)
useUpperDev = input(title="Use Upper Deviation", defval=true)
useLowerDev = input(title="Use Lower Deviation", defval=true)
showPearson = input(title="Show Pearson`s R", defval=true)
extendLines = input(title="Extend Lines", defval=false)
len = input(title="Count", defval=100)
src = input(title="Source", defval=close)
extend = extendLines ? extend.right : extend.none
calcSlope(src, len) =>
max_bars_back(src, 300)
if not barstate.islast or len <= 1
[float(na), float(na), float(na)]
else
sumX = 0.0
sumY = 0.0
sumXSqr = 0.0
sumXY = 0.0
for i = 0 to len - 1
val = src
per = i + 1.0
sumX := sumX + per
sumY := sumY + val
sumXSqr := sumXSqr + per * per
sumXY := sumXY + val * per
slope = (len * sumXY - sumX * sumY) / (len * sumXSqr - sumX * sumX)
average = sumY / len
intercept = average - slope * sumX / len + slope
[slope, average, intercept]
[s, a, i] = calcSlope(src, len)
startPrice = i + s * (len - 1)
endPrice = i
var line baseLine = na
if na(baseLine) and not na(startPrice)
baseLine := line.new(bar_index - len + 1, startPrice, bar_index, endPrice, width=1, extend=extend, color=color.red)
else
line.set_xy1(baseLine, bar_index - len + 1, startPrice)
line.set_xy2(baseLine, bar_index, endPrice)
na
calcDev(src, len, slope, average, intercept) =>
upDev = 0.0
dnDev = 0.0
stdDevAcc = 0.0
dsxx = 0.0
dsyy = 0.0
dsxy = 0.0
periods = len - 1
daY = intercept + (slope * periods) / 2
val = intercept
for i = 0 to periods
price = high - val
if (price > upDev)
upDev := price
price := val - low
if (price > dnDev)
dnDev := price
price := src
dxt = price - average
dyt = val - daY
price := price - val
stdDevAcc := stdDevAcc + price * price
dsxx := dsxx + dxt * dxt
dsyy := dsyy + dyt * dyt
dsxy := dsxy + dxt * dyt
val := val + slope
stdDev = math.sqrt(stdDevAcc / (periods == 0 ? 1 : periods))
pearsonR = dsxx == 0 or dsyy == 0 ? 0 : dsxy / math.sqrt(dsxx * dsyy)
[stdDev, pearsonR, upDev, dnDev]
[stdDev, pearsonR, upDev, dnDev] = calcDev(src, len, s, a, i)
upperStartPrice = startPrice + (useUpperDev ? upperMult * stdDev : upDev)
upperEndPrice = endPrice + (useUpperDev ? upperMult * stdDev : upDev)
var line upper = na
lowerStartPrice = startPrice + (useLowerDev ? lowerMult * stdDev : -dnDev)
lowerEndPrice = endPrice + (useLowerDev ? lowerMult * stdDev : -dnDev)
var line lower = na
if na(upper) and not na(upperStartPrice)
upper := line.new(bar_index - len + 1, upperStartPrice, bar_index, upperEndPrice, width=1, extend=extend, color=#0000ff)
else
line.set_xy1(upper, bar_index - len + 1, upperStartPrice)
line.set_xy2(upper, bar_index, upperEndPrice)
na
if na(lower) and not na(lowerStartPrice)
lower := line.new(bar_index - len + 1, lowerStartPrice, bar_index, lowerEndPrice, width=1, extend=extend, color=#0000ff)
else
line.set_xy1(lower, bar_index - len + 1, lowerStartPrice)
line.set_xy2(lower, bar_index, lowerEndPrice)
na
// Pearson`s R
var label r = na
transparent = color.new(color.white, 100)
label.delete(r[1])
if showPearson and not na(pearsonR)
r := label.new(bar_index - len + 1, lowerStartPrice, str.tostring(pearsonR, "#.################"), color=transparent, textcolor=#0000ff, size=size.normal, style=label.style_label_up)
You can use it to update the indicator on your side.
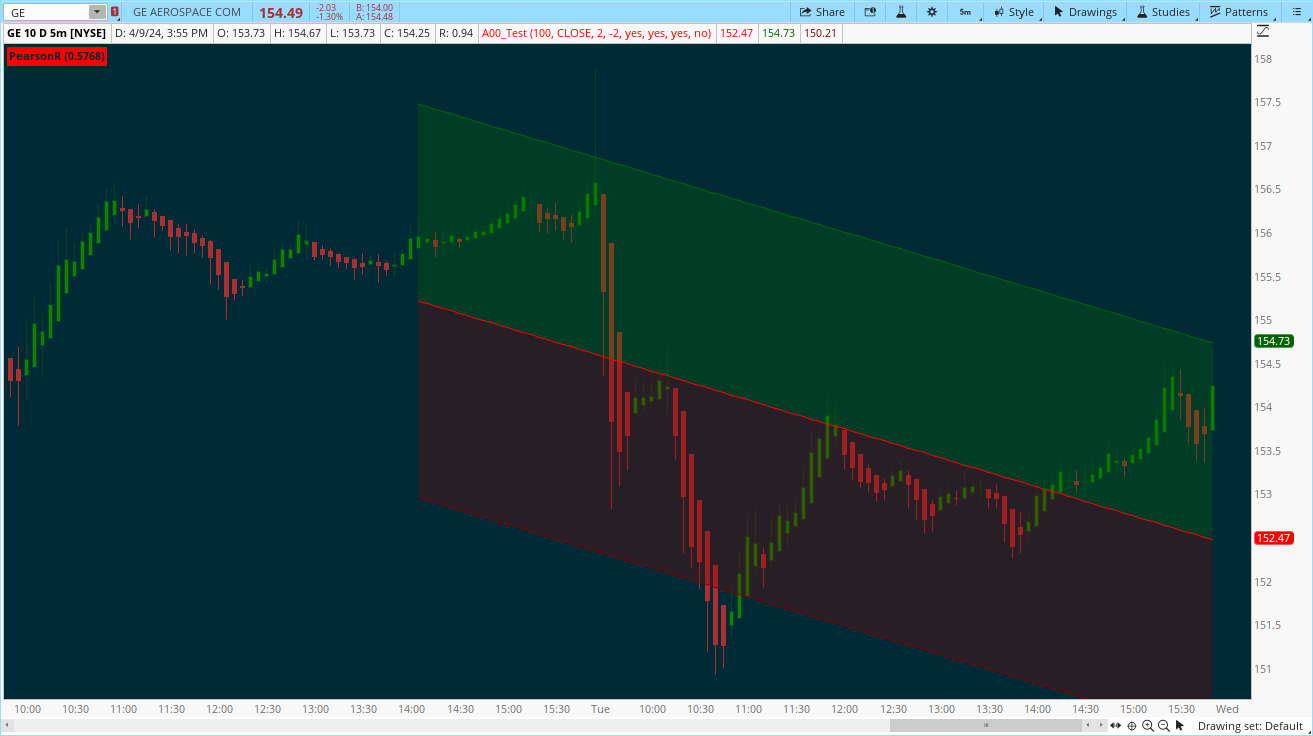
check the below:

CSS:
#//@version=4
#study("Linear Regression", shorttitle="LinReg", overlay=true)
# Converted by Sam4Cok@Samer800    - 04/2024

input length = 100; #(title="Count", defval=100)
input Source = close; #(title="Source", defval=close)
input upperMult = 2; #(title="Upper Deviation", defval=2)
input lowerMult = -2; #(title="Lower Deviation", defval=-2)
input useUpperDev = yes; #(title="Use Upper Deviation", defval=true)
input useLowerDev = yes; #(title="Use Lower Deviation", defval=true)
input showPearson = yes; #(title="Show Pearson's R", defval=true)
input extendLines = no; #(title="Extend Lines", defval=false)


def na = Double.NaN;
def last = isNaN(close);

def MiddleLR = InertiaAll(Source, length, extendToRight = extendLines);
def base = InertiaAll(Source, length);
def sq = Sqr(Source - MiddleLR);
def stdDevAcc = sum(sq, length);
def dev = sqrt(stdDevAcc/length);

def upDev = if isNaN(MiddleLR) then na else
            fold i = 0 to length with p = high - MiddleLR do
            if (high[i] - MiddleLR[i]) > p then (high[i] - MiddleLR[i]) else p;
def dnDev = if isNaN(MiddleLR) then na else
            fold j = 0 to length with q do
            if (MiddleLR[j] - low[j]) > q then (MiddleLR[j] - low[j]) else q;
def stDev = highestAll(dev);
def upStDev = highestAll(upDev);
def dnStDev = lowestAll(dnDev);
def startPrice = if isNaN(MiddleLR[1]) then base else startPrice[1];
def endPrice   = if !last then base else endPrice[1];
def lastSt = highestAll(InertiaAll(startPrice, 2));
def lastEn = highestAll(InertiaAll(endPrice, 2));

plot baseLine = MiddleLR;
plot UpperLR = MiddleLR + (if useUpperDev then upperMult * stDev else upStDev);
plot LowerLR = MiddleLR + (if useLowerDev then lowerMult * stDev else -dnStDev);

AddCloud(UpperLR, MiddleLR, Color.DARK_GREEN);
AddCloud(MiddleLR, LowerLR, Color.DARK_RED);

baseLine.AssignValueColor(if lastEn > lastSt then color.GREEN else
                          if lastEn < lastSt then Color.RED else Color.GRAY);
UpperLR.setDefaultColor(Color.DARK_GREEN);
LowerLR.setDefaultColor(Color.DARK_RED);

def period = length - 1;
def slope = (endPrice - startPrice) / (length);
def sumX = fold i1 = 0 to period with p1 do
            p1 + i1 + 1.0;

def avg = if !last then Average(base, length) else avg[1];
def intercept = if !last then avg - slope * sumX / period + slope else intercept[1];
def daY = if !last then intercept + (slope * length) / 2 else na;
def dsxx = Sum(Sqr(source - highestAll(avg)), length);
def dsyy = Sum(Sqr(base - highestAll(daY)), length);
def dsxy = Sum((source - highestAll(avg)) * (base - highestAll(daY)), length);
def pearsonR = if isNaN(dsxx) or isNaN(dsyy) then 0 else dsxy / sqrt(dsxx * dsyy);


AddLabel(showPearson, "PearsonR (" + pearsonR + ")", if endPrice > startPrice then color.GREEN else
                                                     if endPrice < startPrice then Color.RED else Color.GRAY);
#-- END of CODE
 

Join useThinkScript to post your question to a community of 21,000+ developers and traders.

Similar threads

Not the exact question you're looking for?

Start a new thread and receive assistance from our community.

87k+ Posts
528 Online
Create Post

Similar threads

Similar threads

The Market Trading Game Changer

Join 2,500+ subscribers inside the useThinkScript VIP Membership Club
  • Exclusive indicators
  • Proven strategies & setups
  • Private Discord community
  • ‘Buy The Dip’ signal alerts
  • Exclusive members-only content
  • Add-ons and resources
  • 1 full year of unlimited support

Frequently Asked Questions

What is useThinkScript?

useThinkScript is the #1 community of stock market investors using indicators and other tools to power their trading strategies. Traders of all skill levels use our forums to learn about scripting and indicators, help each other, and discover new ways to gain an edge in the markets.

How do I get started?

We get it. Our forum can be intimidating, if not overwhelming. With thousands of topics, tens of thousands of posts, our community has created an incredibly deep knowledge base for stock traders. No one can ever exhaust every resource provided on our site.

If you are new, or just looking for guidance, here are some helpful links to get you started.

What are the benefits of VIP Membership?
VIP members get exclusive access to these proven and tested premium indicators: Buy the Dip, Advanced Market Moves 2.0, Take Profit, and Volatility Trading Range. In addition, VIP members get access to over 50 VIP-only custom indicators, add-ons, and strategies, private VIP-only forums, private Discord channel to discuss trades and strategies in real-time, customer support, trade alerts, and much more. Learn all about VIP membership here.
How can I access the premium indicators?
To access the premium indicators, which are plug and play ready, sign up for VIP membership here.
Back
Top