
LLP
Member
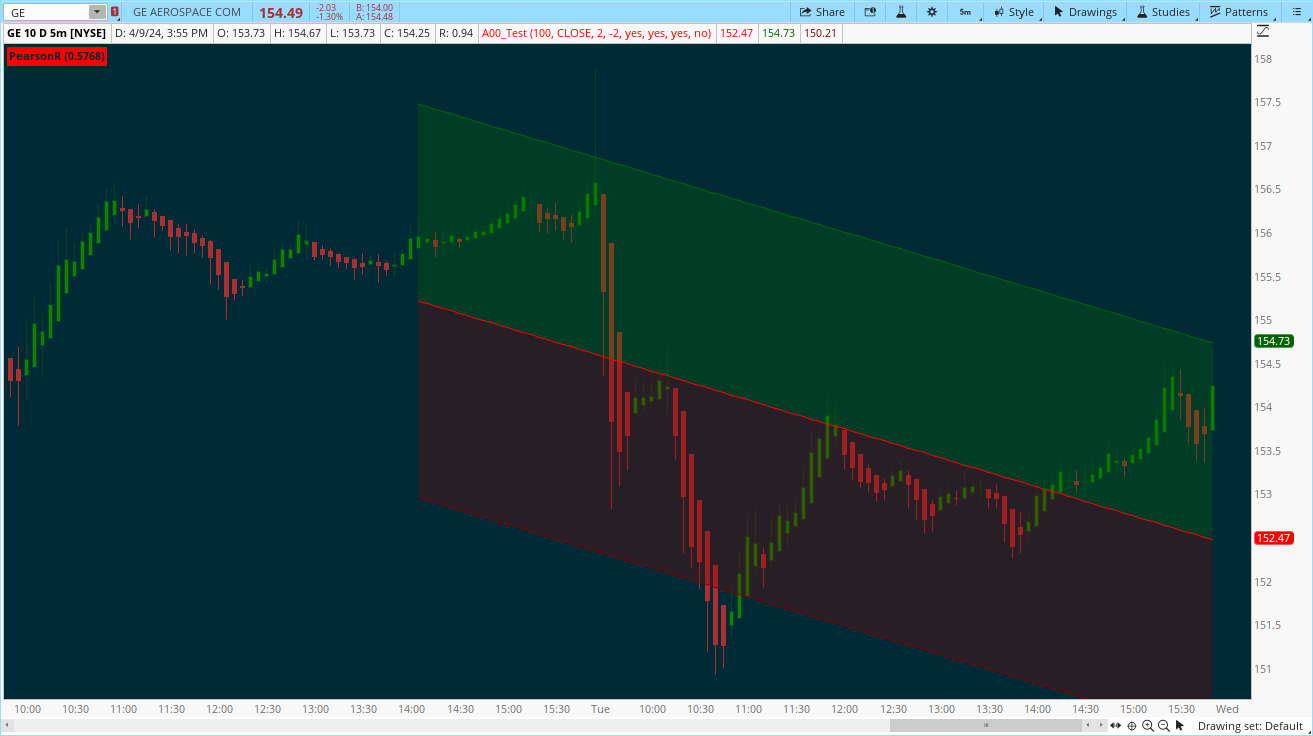
Linear Regression is used to identify trends and potential reversals in stock prices. Here's how it works:
Trend Identification: helps determine the overall trend direction of a stock's price movement over a specific period. It provides a visual representation of whether the stock is trending upwards, downwards, or moving sideways.
Support and Resistance Levels: helps identify potential support and resistance levels. When the price approaches the regression line, it can act as a support or resistance level, indicating potential buying or selling opportunities.
Entry and Exit Zones: when the price deviates significantly from the regression line, it may signal an overbought or oversold condition, prompting traders to enter or exit positions accordingly.
Hi, can someone convert this please?
https://www.tradingview.com/pine-script-docs/en/v4/essential/Drawings.html#linear-regression
Last edited by a moderator: