

johnwood34
Member
Edited Received this script from @halcyonguy on here. Wondering if someone would be willing to make it HTF compatible (already functions on any time-frame). HTF in that i'd like it to print the range of a higher time-frame on a lower time-frame. Would also like it to somehow consider range expansion. Additional pics provided...
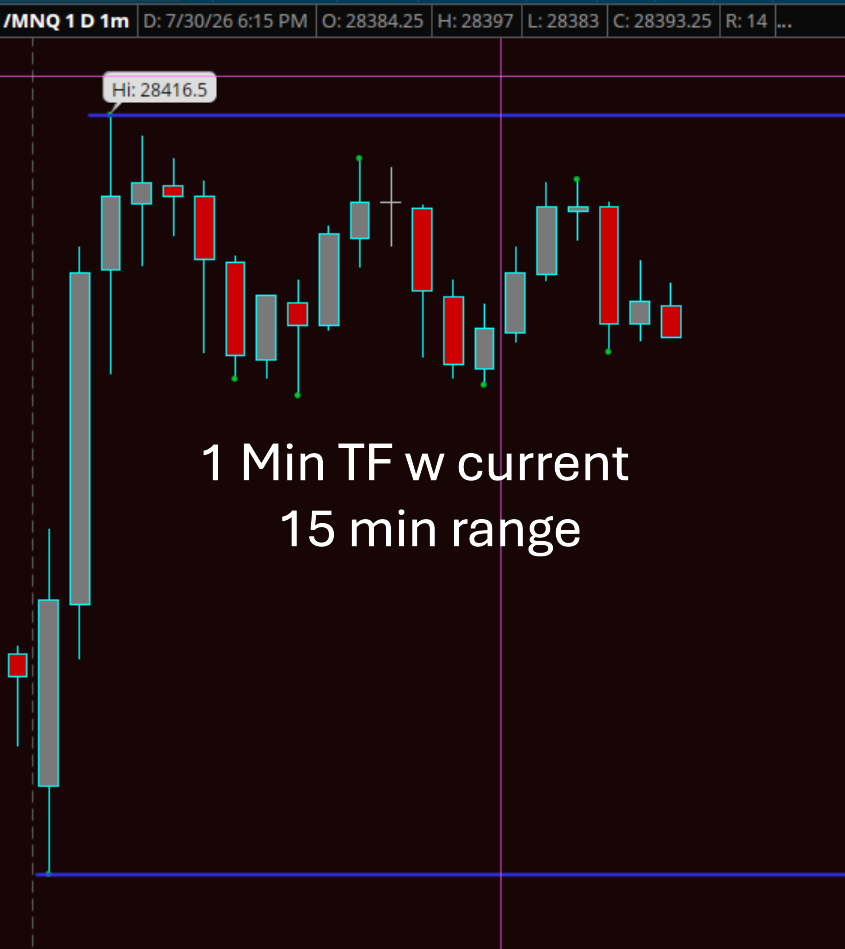
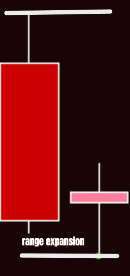
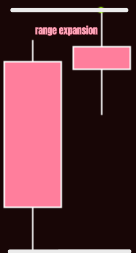
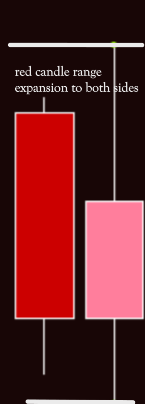
Code:
# candle_range_breakout

#https://usethinkscript.com/threads/looking-for-an-indicator.20817/
#Looking for an indicator

#if candle is bullish,
#mark the high and low of it.
#..If that range is broken by another bullish candle, (close)
#...move my lines up to frame the high and low it.
#If it had been broken by a bearish candle, move lines down to frame that candle.

def na = Double.NaN;
def bn = BarNumber();
def big = 99999;

def o = open;
def h = high;
def l = low;
def c = close;

def grn = c > o;
def red = c < o;

def hi;
def lo;
if bn == 1 or isnan(close) then {
hi = 0;
lo = 0;
} else if grn and c > hi[1] then {
hi = h;
lo = l;
} else if red and c < lo[1] then {
hi = h;
lo = l;
} else {
hi = hi[1];
lo = lo[1];
}


plot z1 = if hi > 0 then hi else na;
plot z2 = if lo > 0 then lo else na;
z1.SetPaintingStrategy(PaintingStrategy.HORIZONTAL);
z2.SetPaintingStrategy(PaintingStrategy.HORIZONTAL);
z1.SetDefaultColor(Color.magenta);
z2.SetDefaultColor(Color.magenta);
#
Last edited by a moderator:

