#scan_code_convert

#https://usethinkscript.com/threads/convert-stockcharts-com-criteria-to-scan.19488/
#Convert stockcharts.com criteria to scan
#Salvie  9/5
#1
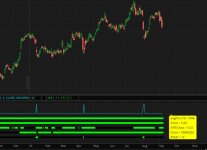
#I am new to thinkorswim and currently using stockcharts.com for a specific script. I would like to convert it to thinkorswim and need help because I don't know the codes to use or the syntax. Here is my current script that I need to convert. Would love help in doing so. Thanks Sal

#[type = stock] (this is obviously stocks
#and [Country is US] (this is obviously USA only)
#and [SMA(14, Volume) > 500,000] (this is 14-day SMA greater than 500,000)
#and [Close > 5.00] (this is for stocks closing greater than $5.)
#and [ATR(14) / Close > 0.02] (This 14-day Average True Range greater than .02)
#and [Close > SMA(200)] (This is close greater than the 200 SMA)
#and [RSI(3) < 10] (this is a 3-day RSI less than 10)


declare lower;

def na = double.nan;
def bn = barnumber();

DefineGlobalColor("true", color.green);
DefineGlobalColor("false", color.black);
#GlobalColor("true")

#-----------------------------------------------------
#and [SMA(14, Volume) > 500,000] (this is 14-day SMA greater than 500,000)
def vol_min = 500000;
def r1 = Average(volume, 14) > vol_min;

#-----------------------------------------------------
#and [Close > 5.00] (this is for stocks closing greater than $5.)
def pr_min = 5;
def r2 = close > pr_min;

#-----------------------------------------------------
#and [ATR(14) / Close > 0.02] (This 14-day Average True Range greater than .02)
def length = 14;
def averageType = AverageType.WILDERS;
def ATR = MovingAverage(averageType, TrueRange(high, close, low), length);
#ATR.SetDefaultColor(GetColor(8));
def r3 = ATR / close > 0.02;

#-----------------------------------------------------
#and [Close > SMA(200)] (This is close greater than the 200 SMA)
#input avg1_type = AverageType.exponential;
def avg1_type = AverageType.SIMPLE;
input avg1_length = 200;
def avg1 = MovingAverage(avg1_type, close, avg1_length );
def r4 = close > avg1;

#-----------------------------------------------------
#and [RSI(3) < 10] (this is a 3-day RSI less than 10)
#  RSI
input rsi_length = 3;
#input rsi_over_Bought = 70;
#input rsi_over_Sold = 30;
input rsi_price = close;
input rsi_averageType = AverageType.WILDERS;
#input showBreakoutSignals = no;
def NetChgAvg = MovingAverage(rsi_averageType, rsi_price - rsi_price[1], rsi_length);
def TotChgAvg = MovingAverage(rsi_averageType, AbsValue(rsi_price - rsi_price[1]), rsi_length);
def ChgRatio = if TotChgAvg != 0 then NetChgAvg / TotChgAvg else 0;
def RSI = 50 * (ChgRatio + 1);
#def OverSold = rsi_over_Sold;
#def OverBought = rsi_over_Bought;
#def UpSignal = if RSI crosses above OverSold then OverSold else Double.NaN;
#def DownSignal = if RSI crosses below OverBought then OverBought else Double.NaN;
#plot z = rsi;
def r5 = RSI < 10;
#-----------------------------------------------------

def sig = r1 and r2 and r3 and r4 and r5;
plot z0 = sig;
plot y1 = 1.2;
y1.SetDefaultColor(Color.black);
plot y2 = -3;
y2.SetDefaultColor(Color.black);


#--------------------------------

# for a scan, delete code below this line
# code after this is used in the lower chart study


plot z1 = if isnan(close) then na else -.5;
z1.SetPaintingStrategy(PaintingStrategy.POINTS);
z1.AssignValueColor(if r1 then GlobalColor("true") else GlobalColor("false"));
z1.SetLineWeight(4);
#z1.hidebubble();

plot z2 = if isnan(close) then na else -1;
z2.SetPaintingStrategy(PaintingStrategy.POINTS);
z2.AssignValueColor(if r2 then GlobalColor("true") else GlobalColor("false"));
z2.SetLineWeight(4);
#z2.hidebubble();

plot z3 = if isnan(close) then na else -1.5;
z3.SetPaintingStrategy(PaintingStrategy.POINTS);
z3.AssignValueColor(if r3 then GlobalColor("true") else GlobalColor("false"));
z3.SetLineWeight(4);
#z3.hidebubble();

plot z4 = if isnan(close) then na else -2;
z4.SetPaintingStrategy(PaintingStrategy.POINTS);
z4.AssignValueColor(if r4 then GlobalColor("true") else GlobalColor("false"));
z4.SetLineWeight(4);
#z4.hidebubble();

plot z5 = if isnan(close) then na else -2.5;
z5.SetPaintingStrategy(PaintingStrategy.POINTS);
z5.AssignValueColor(if r5 then GlobalColor("true") else GlobalColor("false"));
z5.SetLineWeight(4);
#z5.hidebubble();


def x = 9;
def bub = !isnan(close[x+1]) and isnan(close[x]);
addchartbubble(bub, 0,
"avg(Vol,14) > 500k\n" +
"Close > 5.00\n" +
"ATR/Close > 0.02\n" +
"Close > SMA(200)\n" +
"RSI(3) < 10"
, color.yellow, no);
#

