#compare_percent_00b
# make it an upper
# chart sym is master
# scale other to it
# shift others vert, so they are at same close on bar 1
#---------------------------------
def na = double.nan;
def bn = barnumber();
#https://usethinkscript.com/threads/how-to-compare-stock-charts-in-thinkorswim.13055/
#Indicators Custom
#How to Compare Stock Charts in ThinkorSwim
#JADragon3 Feb 29, 2020 #1
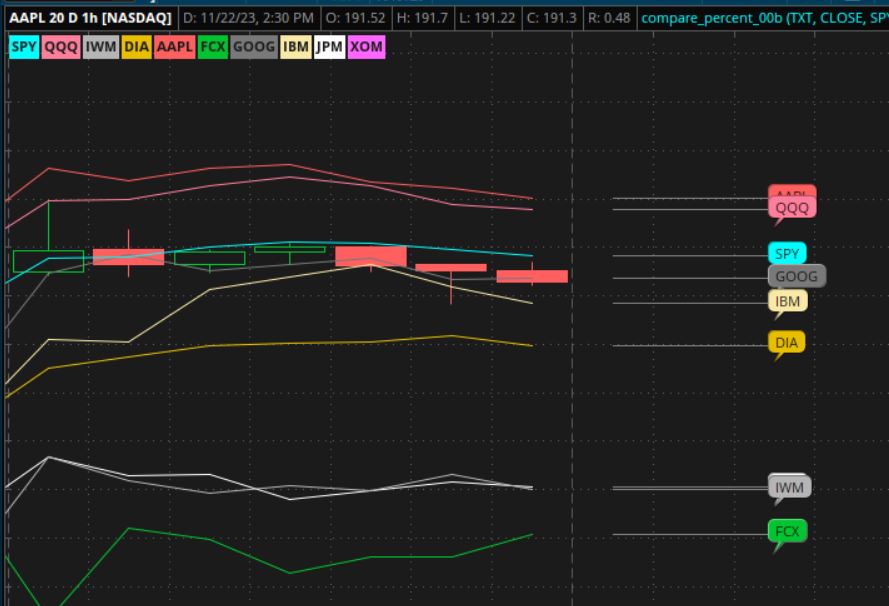
#Multi Symbol Comparison as a lower study. You can get pretty creative with it. Add composite symbols to track indexes for better visualization.
#declare lower;
#hint showKey: OFF hides the symbol key, NUM numbers the symbol text, TXT shows just the symbol text.
input showKey = {OFF, NUM, default TXT};
#hint price: Changes the fundamental price type.
input price = FundamentalType.CLOSE;
# limits on chart
# using price dont work
#def hh = HighestAll(price);
def hh = HighestAll(close);
def ll = LowestAll(close);
def off1 = if bn == 1 then close else off1[1];
#addlabel(1, hh, color.yellow);
#addlabel(1, ll, color.yellow);
#The following symbols may be changed to your preference but none should be blank. You may turn off any of these via the 'input use? = ' function. Each symbol is implied-numbered from 1 to 10, top-to-bottom sequentially.
input symbol1 = "SPY";
input symbol2 = "QQQ";
input symbol3 = "IWM";
input symbol4 = "DIA";
input symbol5 = "AAPL";
input symbol6 = "FCX";
input symbol7 = "GOOG";
input symbol8 = "IBM";
input symbol9 = "JPM";
input symbol10 = "XOM";
#hint use1: use1 to use10 toggle display of their respective symbol.
input use1 = Yes;
input use2 = Yes;
input use3 = Yes;
input use4 = Yes;
input use5 = Yes;
input use6 = Yes;
input use7 = Yes;
input use8 = Yes;
input use9 = Yes;
input use10 = Yes;
# changing the Min and Max values will determine the minimum and maximum plotted values for all symbols.
script normalize {
input data = close;
input Min = -100;
input Max = 100;
def ha = HighestAll( data );
def la = LowestAll( data );
plot normalize = (((Max - Min) * (data - la)) / (ha - la)) + Min;
}
def s1 = if use1 then Fundamental(price, symbol1) else Double.NaN;
def s2 = if use2 then Fundamental(price, symbol2) else Double.NaN;
def s3 = if use3 then Fundamental(price, symbol3) else Double.NaN;
def s4 = if use4 then Fundamental(price, symbol4) else Double.NaN;
def s5 = if use5 then Fundamental(price, symbol5) else Double.NaN;
def s6 = if use6 then Fundamental(price, symbol6) else Double.NaN;
def s7 = if use7 then Fundamental(price, symbol7) else Double.NaN;
def s8 = if use8 then Fundamental(price, symbol8) else Double.NaN;
def s9 = if use9 then Fundamental(price, symbol9) else Double.NaN;
def s10 = if use10 then Fundamental(price, symbol10) else Double.NaN;
def r1 = CompoundValue(1, if !IsNaN(s1) then normalize(s1, ll, hh) else r1[1], Double.NaN);
def r2 = CompoundValue(1, if !IsNaN(s2) then normalize(s2, ll, hh) else r2[1], Double.NaN);
def r3 = CompoundValue(1, if !IsNaN(s3) then normalize(s3, ll, hh) else r3[1], Double.NaN);
def r4 = CompoundValue(1, if !IsNaN(s4) then normalize(s4, ll, hh) else r4[1], Double.NaN);
def r5 = CompoundValue(1, if !IsNaN(s5) then normalize(s5, ll, hh) else r5[1], Double.NaN);
def r6 = CompoundValue(1, if !IsNaN(s6) then normalize(s6, ll, hh) else r6[1], Double.NaN);
def r7 = CompoundValue(1, if !IsNaN(s7) then normalize(s7, ll, hh) else r7[1], Double.NaN);
def r8 = CompoundValue(1, if !IsNaN(s8) then normalize(s8, ll, hh) else r8[1], Double.NaN);
def r9 = CompoundValue(1, if !IsNaN(s9) then normalize(s9, ll, hh) else r9[1], Double.NaN);
def r10 = CompoundValue(1, if !IsNaN(s10) then normalize(s10, ll, hh) else r10[1], Double.NaN);
# States: 0 = Not initialized, 1 = Initialized.
def st = {default "0", "1"};
# Offsets:
def ofst1;
def ofst2;
def ofst3;
def ofst4;
def ofst5;
def ofst6;
def ofst7;
def ofst8;
def ofst9;
def ofst10;
if st[1] == st."0" {
if (!use1 or !IsNaN(r1)) and (!use2 or !IsNaN(r2))
and (!use3 or !IsNaN(r3)) and (!use4 or !IsNaN(r4))
and (!use5 or !IsNaN(r5)) and (!use6 or !IsNaN(r6))
and (!use7 or !IsNaN(r7)) and (!use8 or !IsNaN(r8))
and (!use9 or !IsNaN(r9)) and (!use10 or !IsNaN(r10))
{
ofst1 = r1;
ofst2 = r2;
ofst3 = r3;
ofst4 = r4;
ofst5 = r5;
ofst6 = r6;
ofst7 = r7;
ofst8 = r8;
ofst9 = r9;
ofst10 = r10;
st = st."1";
} else {
# Not initialized.
ofst1 = Double.NaN;
ofst2 = Double.NaN;
ofst3 = Double.NaN;
ofst4 = Double.NaN;
ofst5 = Double.NaN;
ofst6 = Double.NaN;
ofst7 = Double.NaN;
ofst8 = Double.NaN;
ofst9 = Double.NaN;
ofst10 = Double.NaN;
st = st[1];
}
} else {
ofst1 = ofst1[1];
ofst2 = ofst2[1];
ofst3 = ofst3[1];
ofst4 = ofst4[1];
ofst5 = ofst5[1];
ofst6 = ofst6[1];
ofst7 = ofst7[1];
ofst8 = ofst8[1];
ofst9 = ofst9[1];
ofst10 = ofst10[1];
st = st[1];
}
def ok = !IsNaN(close) and st == st."1";
plot p1 = if ok then r1 - ofst1 + off1 else Double.NaN;
plot p2 = if ok then r2 - ofst2 + off1 else Double.NaN;
plot p3 = if ok then r3 - ofst3 + off1 else Double.NaN;
plot p4 = if ok then r4 - ofst4 + off1 else Double.NaN;
plot p5 = if ok then r5 - ofst5 + off1 else Double.NaN;
plot p6 = if ok then r6 - ofst6 + off1 else Double.NaN;
plot p7 = if ok then r7 - ofst7 + off1 else Double.NaN;
plot p8 = if ok then r8 - ofst8 + off1 else Double.NaN;
plot p9 = if ok then r9 - ofst9 + off1 else Double.NaN;
plot p10 = if ok then r10 - ofst10 + off1 else Double.NaN;
#plot Zero = 0;
#Zero.SetDefaultColor(Color.GRAY);
def n = showKey == showKey.NUM;
AddLabel(showKey and use1, (if n then "1. " else "") + symbol1, p1.TakeValueColor());
AddLabel(showKey and use2, (if n then "2. " else "") + symbol2, p2.TakeValueColor());
AddLabel(showKey and use3, (if n then "3. " else "") + symbol3, p3.TakeValueColor());
AddLabel(showKey and use4, (if n then "4. " else "") + symbol4, p4.TakeValueColor());
AddLabel(showKey and use5, (if n then "5. " else "") + symbol5, p5.TakeValueColor());
AddLabel(showKey and use6, (if n then "6. " else "") + symbol6, p6.TakeValueColor());
AddLabel(showKey and use7, (if n then "7. " else "") + symbol7, p7.TakeValueColor());
AddLabel(showKey and use8, (if n then "8. " else "") + symbol8, p8.TakeValueColor());
AddLabel(showKey and use9, (if n then "9. " else "") + symbol9, p9.TakeValueColor());
AddLabel(showKey and use10, (if n then "10. " else "") + symbol10, p10.TakeValueColor());
#Bubble
input bubble = yes;
input bubblemover = 2;
def bm = bubblemover;
def bm1 = bm + 1;
def x = IsNaN(close[bubblemover]) and !IsNaN(close[bubblemover + 1]);
def v = -0.002;
#def v = -0.00;
AddChartBubble(bubble and x, p1[bm1] * (1+v), symbol1, p1.TakeValueColor());
AddChartBubble(bubble and x, p2[bm1] * (1+v), symbol2, p2.TakeValueColor());
AddChartBubble(bubble and x, p3[bm1] * (1+v), symbol3, p3.TakeValueColor());
AddChartBubble(bubble and x, p4[bm1] * (1+v), symbol4, p4.TakeValueColor());
AddChartBubble(bubble and x, p5[bm1] * (1+v), symbol5, p5.TakeValueColor());
AddChartBubble(bubble and x, p6[bm1] * (1+v), symbol6, p6.TakeValueColor());
AddChartBubble(bubble and x, p7[bm1] * (1+v), symbol7, p7.TakeValueColor());
AddChartBubble(bubble and x, p8[bm1] * (1+v), symbol8, p8.TakeValueColor());
AddChartBubble(bubble and x, p9[bm1] * (1+v), symbol9, p9.TakeValueColor());
AddChartBubble(bubble and x, p10[bm1] * (1+v), symbol10, p10.TakeValueColor());
# bars away to start horz line
def k = 1;
def bubline = IsNaN(close[k-1]) and !IsNaN(close[bubblemover + 1]);
def w1 = if (bubble and use1 and !isNaN(close[k]) and isNaN(close[k-1])) then p1[k] else if bubline then w1[1] else na;
def w2 = if (bubble and use2 and !isNaN(close[k]) and isNaN(close[k-1])) then p2[k] else if bubline then w2[1] else na;
def w3 = if (bubble and use3 and !isNaN(close[k]) and isNaN(close[k-1])) then p3[k] else if bubline then w3[1] else na;
def w4 = if (bubble and use4 and !isNaN(close[k]) and isNaN(close[k-1])) then p4[k] else if bubline then w4[1] else na;
def w5 = if (bubble and use5 and !isNaN(close[k]) and isNaN(close[k-1])) then p5[k] else if bubline then w5[1] else na;
def w6 = if (bubble and use6 and !isNaN(close[k]) and isNaN(close[k-1])) then p6[k] else if bubline then w6[1] else na;
def w7 = if (bubble and use7 and !isNaN(close[k]) and isNaN(close[k-1])) then p7[k] else if bubline then w7[1] else na;
def w8 = if (bubble and use8 and !isNaN(close[k]) and isNaN(close[k-1])) then p8[k] else if bubline then w8[1] else na;
def w9 = if (bubble and use9 and !isNaN(close[k]) and isNaN(close[k-1])) then p9[k] else if bubline then w9[1] else na;
def w10 = if (bubble and use10 and !isNaN(close[k]) and isNaN(close[k-1])) then p10[k] else if bubline then w10[1] else na;
plot zw1 = w1;
zw1.SetDefaultColor(Color.gray);
zw1.hidebubble();
plot zw2 = w2;
zw2.SetDefaultColor(Color.gray);
zw2.hidebubble();
plot zw3 = w3;
zw3.SetDefaultColor(Color.gray);
zw3.hidebubble();
plot zw4 = w4;
zw4.SetDefaultColor(Color.gray);
zw4.hidebubble();
plot zw5 = w5;
zw5.SetDefaultColor(Color.gray);
zw5.hidebubble();
plot zw6 = w6;
zw6.SetDefaultColor(Color.gray);
zw6.hidebubble();
plot zw7 = w7;
zw7.SetDefaultColor(Color.gray);
zw7.hidebubble();
plot zw8 = w8;
zw8.SetDefaultColor(Color.gray);
zw8.hidebubble();
plot zw9 = w9;
zw9.SetDefaultColor(Color.gray);
zw9.hidebubble();
plot zw10 = w10;
zw10.SetDefaultColor(Color.gray);
zw10.hidebubble();
#