Command Center For ThinkOrSwim Trading

Mr_Wheeler

Active member
I updated this link to the newest version of this setup to include study/script feature updates on the date of August 03 2023

Here's the update information. It's currently on Version 3.


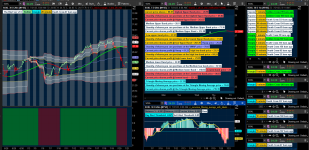
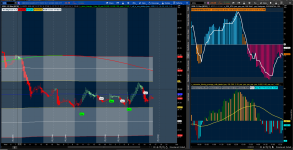
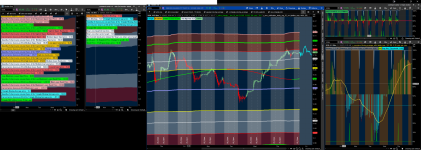
The lower center indicator is my momentum indicator. I prefer the 20 minute time frame.
command center.png
 
Last edited:
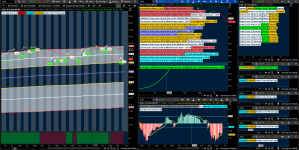
I upgraded the setup by adding new features to the center bottom study. I updated the flexible grid with the V2 version.
 

Attachments

  • commander center v2.png
    commander center v2.png
    722.9 KB · Views: 356
I upgraded code to

  1. add functionality with a year time frame
  2. buy & sell bubbles,
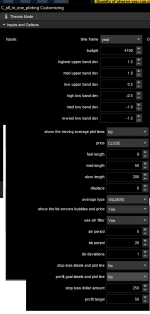
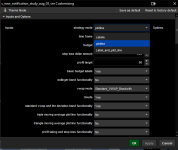
  3. cleaned up the configuration menu
  4. removed redundant label code as I moved the label functionality to a 2nd study but didn't clean out the code.
  5. moved a bunch of study input functions into condensed number of inputs in the config menu so you don't need to move a bunch of extra toggles.

You can get this new functionality with the updated flexible grid download link.

I also updated the label study to include the year time frame code so the labels can display correct information.
 

Attachments

  • command center v3.png
    command center v3.png
    699.3 KB · Views: 360
  • new.png
    new.png
    25.5 KB · Views: 320
I upgraded code to

  1. add functionality with a year time frame
  2. buy & sell bubbles,
  3. cleaned up the configuration menu
  4. removed redundant label code as I moved the label functionality to a 2nd study but didn't clean out the code.
  5. moved a bunch of study input functions into condensed number of inputs in the config menu so you don't need to move a bunch of extra toggles.

You can get this new functionality with the updated flexible grid download link.

I also updated the label study to include the year time frame code so the labels can display correct information.
hi, quite complex but interesting setup. do you have a video showing how do you use your command center or some kind of explaining on that? also, would you use it for longer periods tradings like with daily charts?
 
hi, quite complex but interesting setup. do you have a video showing how do you use your command center or some kind of explaining on that? also, would you use it for longer periods tradings like with daily charts?

TDLR I'm a millennial who grew up with videogame GUIs such as heads up displays,

The game industry has spent hundreds of billions or perhaps trillions of dollars developing games, and we're just individuals. I actually enjoy modding scripts & the layouts like I mod games.


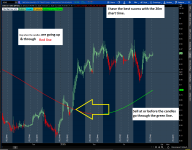
  1. I'm a fan of the triangle moving average, setting it up to target the 200 MDA on the 20 minute chart. I use to care about watching a short, medium, and long moving average lines, but I moved from that.

  2. What I do is purchase as the candles head into the 200 Triangle MDA line when it's red, then sell when the candles are going into the green plot line
  3. On the big picture there are these two histogram studies, I'm looking into them as my market energy/momentum indicators. I have one of them set up so that when I see orange bars I set a stop loss at a vwap deviation band that's bellow the current price, the that way I'm able to lock in profit.
  4. .
  5. Orange is a neutral bar,not bullish or bearish, but neutral.


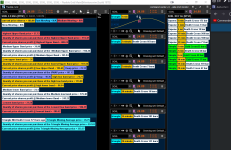
The Straight lines are deviations of the VWAP. They're color coded to match the group of labels to tell you how much you'll lose or gain depending on the direction of the market.

"Current price shares profit @ lowest band" tells you how much you'll lose or gain at that band.

"Quality of shares you can purchase at the lowest low band price" tells you how many shares you can buy so you can make a quick order setup.

"lowest band price" tells you the current price at that deviation of the VWAP.

All of this changes depending on how much of a trading budget you set up, and what sort of deviation you feels the correction direction to go with.


A bunch of websites have simple & exponential, but I care about the triangle MA. I can't figure out how to add a custom moving average with the simple & Expoential moving average labels.


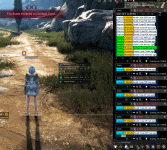
This "mini-monitor" image is a screen shot of a small monitor that I moved these labels onto.

The other image is my set current setup.

The "buy" & "sell" bubbles are Bollinger band stuff but I don't like such systems, it's tea leafs, and I feel that the more complex a trading system is the less likely I'm able to follow it which means I get in trouble.

It's just legacy features that I've included in my code from a while back ago. I don't mind working on it but I don't use it.


I'm a fan of SOXL & SOXS because I keep up with technology news & the stock movement is not only predictable but I'm also able to always follow the market's movement instead of waiting potentially weeks for say an entry.

Don't predict where the market is going, just follow the moving averages, and wait for an entry to show up.
 

Attachments

  • my idea.gif
    my idea.gif
    519.6 KB · Views: 411
  • cvvccxvvxcxcv.png
    cvvccxvvxcxcv.png
    449.7 KB · Views: 415
  • mini monitor.png
    mini monitor.png
    143.1 KB · Views: 402
TDLR I'm a millennial who grew up with videogame GUIs such as heads up displays,

The game industry has spent hundreds of billions or perhaps trillions of dollars developing games, and we're just individuals. I actually enjoy modding scripts & the layouts like I mod games.


  1. I'm a fan of the triangle moving average, setting it up to target the 200 MDA on the 20 minute chart. I use to care about watching a short, medium, and long moving average lines, but I moved from that.

  2. What I do is purchase as the candles head into the 200 Triangle MDA line when it's red, then sell when the candles are going into the green plot line
  3. On the big picture there are these two histogram studies, I'm looking into them as my market energy/momentum indicators. I have one of them set up so that when I see orange bars I set a stop loss at a vwap deviation band that's bellow the current price, the that way I'm able to lock in profit.
  4. .
  5. Orange is a neutral bar,not bullish or bearish, but neutral.


The Straight lines are deviations of the VWAP. They're color coded to match the group of labels to tell you how much you'll lose or gain depending on the direction of the market.

"Current price shares profit @ lowest band" tells you how much you'll lose or gain at that band.

"Quality of shares you can purchase at the lowest low band price" tells you how many shares you can buy so you can make a quick order setup.

"lowest band price" tells you the current price at that deviation of the VWAP.

All of this changes depending on how much of a trading budget you set up, and what sort of deviation you feels the correction direction to go with.


A bunch of websites have simple & exponential, but I care about the triangle MA. I can't figure out how to add a custom moving average with the simple & Expoential moving average labels.


This "mini-monitor" image is a screen shot of a small monitor that I moved these labels onto.

The other image is my set current setup.

The "buy" & "sell" bubbles are Bollinger band stuff but I don't like such systems, it's tea leafs, and I feel that the more complex a trading system is the less likely I'm able to follow it which means I get in trouble.

It's just legacy features that I've included in my code from a while back ago. I don't mind working on it but I don't use it.


I'm a fan of SOXL & SOXS because I keep up with technology news & the stock movement is not only predictable but I'm also able to always follow the market's movement instead of waiting potentially weeks for say an entry.

Don't predict where the market is going, just follow the moving averages, and wait for an entry to show up.
Hi, still amazed. I will slowly digest what you said. Thanks 🍕
 
Hi, still amazed. I will slowly digest what you said. Thanks 🍕
I included the picture of the screenshot of the video game that has my study on it to help you visualize how I was inspired to create this set up. If you were curious.

Think of taking profits as game quests, and the big group of labels as your quest log on your game HUD that tells you what you need to acomplish .

Here's a 2nd image to help explain the triangle moving average. It's too big to directly upload to this site.


Attachments

  • cvvbvbc.png
    cvvbvbc.png
    114.4 KB · Views: 307
very interesting setup can you please elaborate and explain more on this setup? I am not sure what the right side windows chart are for. thank you in advance.

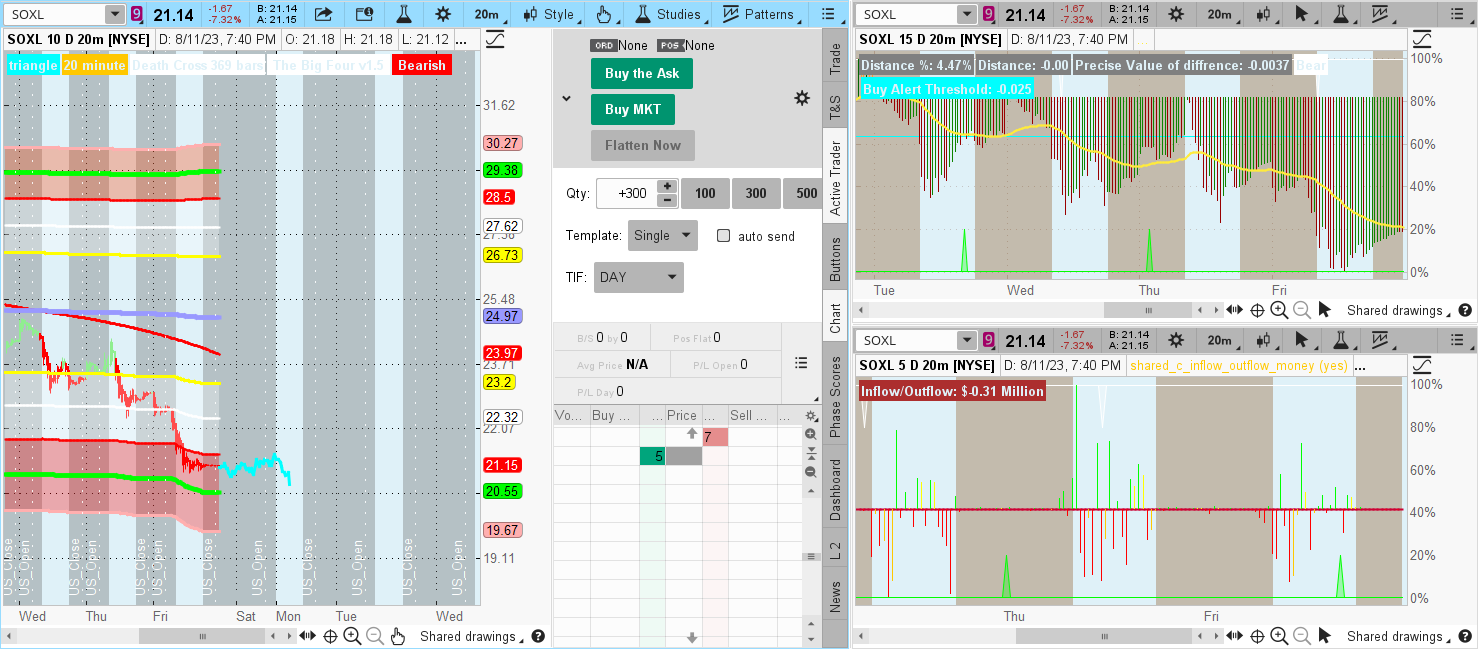
Sure. This is my complete setup.

https://tos.mx/Ul1I2PV : The Labels. You can switch between the labels & the plot lines in the settings.

Ok. I've set up the bottom right for a momentum indicator.


Red - Intense selling off.
Cyan for selling off that's cooling
Green - Buying Momentum
Orange - Buying that's slowing down.


The top right study is money inflow.


I use to use a 3 moving average plot line indicator until I found this Triangle Moving average plot line. I set it up so when candles are going Up & Through the plotline when it's red then it's time to start buy, and when it's abut to plunge through the plot line when it's green it's time to sell.

I suggest you go to this link as I have images to help explain my train of thought.

https://usethinkscript.com/threads/command-center-for-thinkorswim-trading.16100/#post-129525

I'm going to update my " Strategies & Chart Setups " thread after I've add some features to my center screen study,

The momentum study & money study is designed to help you time a bullish & Bearish triangle moving average trend.

The center plot lines help you not only tell you how much money you'll win and lose at certain thresholds on the chart, but they also help you set up stop-orders for profit taking.
 

Attachments

  • gfdgfd.png
    gfdgfd.png
    456.5 KB · Views: 366
  • czxxzxcxczxcz.png
    czxxzxcxczxcz.png
    24.5 KB · Views: 359
Sure. This is my complete setup.

https://tos.mx/Ul1I2PV : The Labels. You can switch between the labels & the plot lines in the settings.

Ok. I've set up the bottom right for a momentum indicator.


Red - Intense selling off.
Cyan for selling off that's cooling
Green - Buying Momentum
Orange - Buying that's slowing down.


The top right study is money inflow.


I use to use a 3 moving average plot line indicator until I found this Triangle Moving average plot line. I set it up so when candles are going Up & Through the plotline when it's red then it's time to start buy, and when it's abut to plunge through the plot line when it's green it's time to sell.

I suggest you go to this link as I have images to help explain my train of thought.

https://usethinkscript.com/threads/command-center-for-thinkorswim-trading.16100/#post-129525

I'm going to update my " Strategies & Chart Setups " thread after I've add some features to my center screen study,

The momentum study & money study is designed to help you time a bullish & Bearish triangle moving average trend.

The center plot lines help you not only tell you how much money you'll win and lose at certain thresholds on the chart, but they also help you set up stop-orders for profit taking.
Thank you very much for explaining it. i am going through all the points you have mentioned and please update if you change anything. I am going to observe this next week. thanks again.
 
Thank you very much for explaining it. i am going through all the points you have mentioned and please update if you change anything. I am going to observe this next week. thanks again.

I like changing things out as I make sure to ask myself "Am I really using this feature?". If I post an image be sure to check if any of the indicators have changed. It's fun programing to be honest, and then going back to the drawing board if something happened like I found a gap in my strategy.

So I won't be offended if you have any questions. In fact I like when others do so because it helps me get me thinking.
 
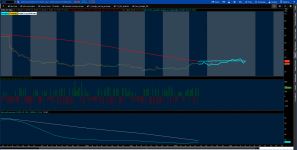
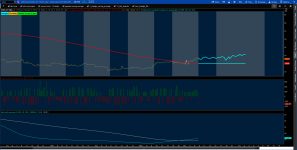
I took the Price projection based on seasonality for ThinkOrSwim and bolted it onto this Triangle Moving Average study of mine.

http://tos.mx/ZlEKYcn
 

Attachments

  • 2023-08-13-TOS_CHARTS.png
    2023-08-13-TOS_CHARTS.png
    287 KB · Views: 414
  • after.png
    after.png
    290.3 KB · Views: 414

Join useThinkScript to post your question to a community of 21,000+ developers and traders.

Not the exact question you're looking for?

Start a new thread and receive assistance from our community.

87k+ Posts
330 Online
Create Post

The Market Trading Game Changer

Join 2,500+ subscribers inside the useThinkScript VIP Membership Club
  • Exclusive indicators
  • Proven strategies & setups
  • Private Discord community
  • ‘Buy The Dip’ signal alerts
  • Exclusive members-only content
  • Add-ons and resources
  • 1 full year of unlimited support

Frequently Asked Questions

What is useThinkScript?

useThinkScript is the #1 community of stock market investors using indicators and other tools to power their trading strategies. Traders of all skill levels use our forums to learn about scripting and indicators, help each other, and discover new ways to gain an edge in the markets.

How do I get started?

We get it. Our forum can be intimidating, if not overwhelming. With thousands of topics, tens of thousands of posts, our community has created an incredibly deep knowledge base for stock traders. No one can ever exhaust every resource provided on our site.

If you are new, or just looking for guidance, here are some helpful links to get you started.

What are the benefits of VIP Membership?
VIP members get exclusive access to these proven and tested premium indicators: Buy the Dip, Advanced Market Moves 2.0, Take Profit, and Volatility Trading Range. In addition, VIP members get access to over 50 VIP-only custom indicators, add-ons, and strategies, private VIP-only forums, private Discord channel to discuss trades and strategies in real-time, customer support, trade alerts, and much more. Learn all about VIP membership here.
How can I access the premium indicators?
To access the premium indicators, which are plug and play ready, sign up for VIP membership here.
Back
Top