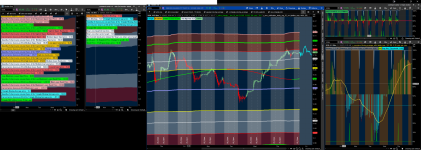
TDLR I'm a millennial who grew up with videogame GUIs such as heads up displays,
The game industry has spent hundreds of billions or perhaps trillions of dollars developing games, and we're just individuals. I actually enjoy modding scripts & the layouts like I mod games.
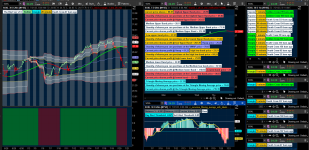
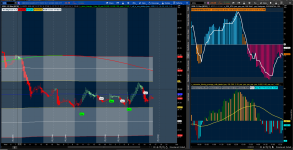
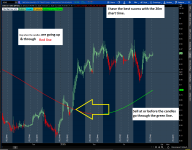
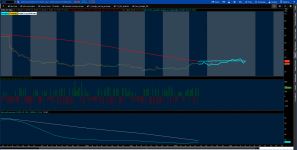
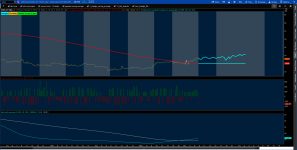
- I'm a fan of the triangle moving average, setting it up to target the 200 MDA on the 20 minute chart. I use to care about watching a short, medium, and long moving average lines, but I moved from that.
- What I do is purchase as the candles head into the 200 Triangle MDA line when it's red, then sell when the candles are going into the green plot line
- On the big picture there are these two histogram studies, I'm looking into them as my market energy/momentum indicators. I have one of them set up so that when I see orange bars I set a stop loss at a vwap deviation band that's bellow the current price, the that way I'm able to lock in profit.
- .
- Orange is a neutral bar,not bullish or bearish, but neutral.
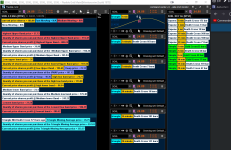
The Straight lines are deviations of the VWAP. They're color coded to match the group of labels to tell you how much you'll lose or gain depending on the direction of the market.
"Current price shares profit @ lowest band" tells you how much you'll lose or gain at that band.
"Quality of shares you can purchase at the lowest low band price" tells you how many shares you can buy so you can make a quick order setup.
"lowest band price" tells you the current price at that deviation of the VWAP.
All of this changes depending on how much of a trading budget you set up, and what sort of deviation you feels the correction direction to go with.
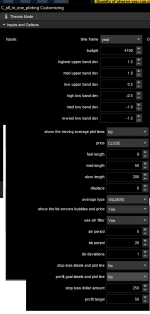
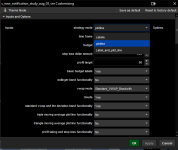
A bunch of websites have simple & exponential, but I care about the triangle MA. I can't figure out how to add a custom moving average with the simple & Expoential moving average labels.
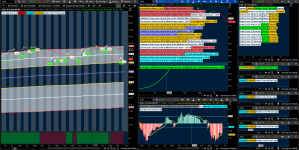
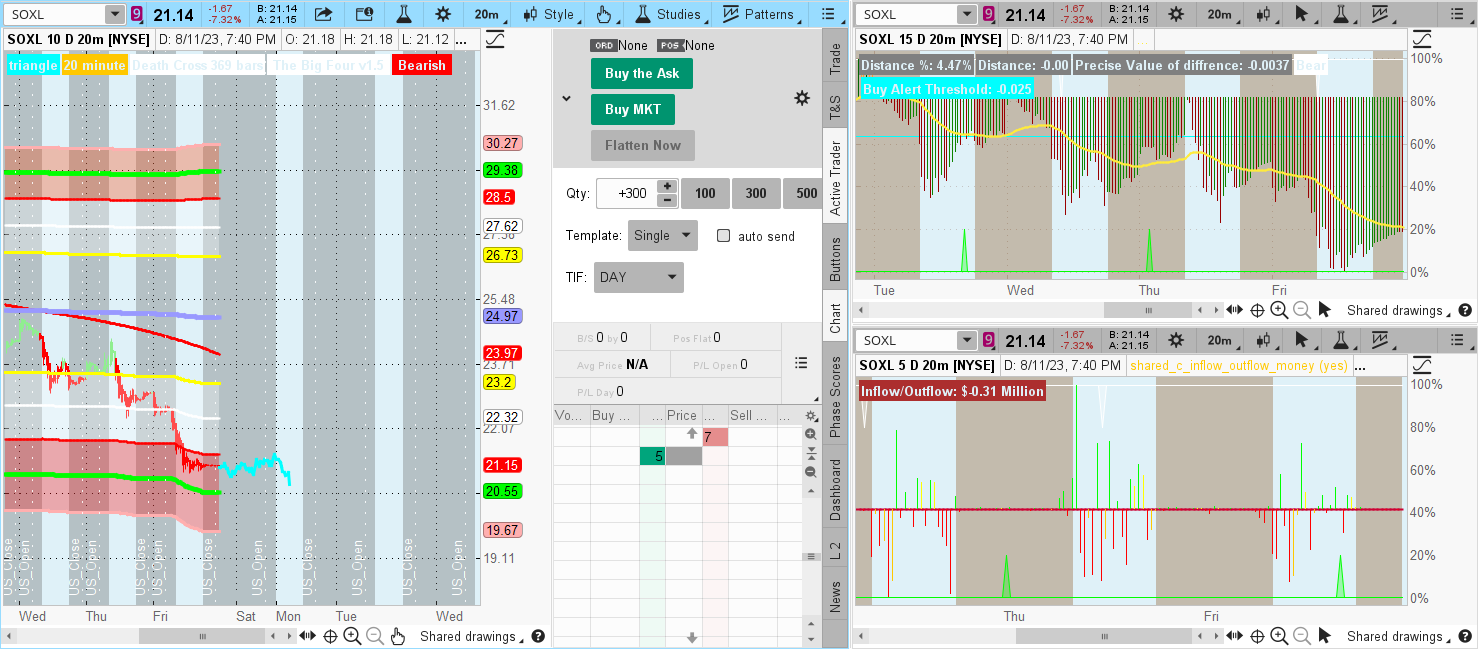
This "mini-monitor" image is a screen shot of a small monitor that I moved these labels onto.
The other image is my set current setup.
The "buy" & "sell" bubbles are Bollinger band stuff but I don't like such systems, it's tea leafs, and I feel that the more complex a trading system is the less likely I'm able to follow it which means I get in trouble.
It's just legacy features that I've included in my code from a while back ago. I don't mind working on it but I don't use it.
I'm a fan of SOXL & SOXS because I keep up with technology news & the stock movement is not only predictable but I'm also able to always follow the market's movement instead of waiting potentially weeks for say an entry.
Don't predict where the market is going, just follow the moving averages, and wait for an entry to show up.