
andriod_1011
New member
Hi All,
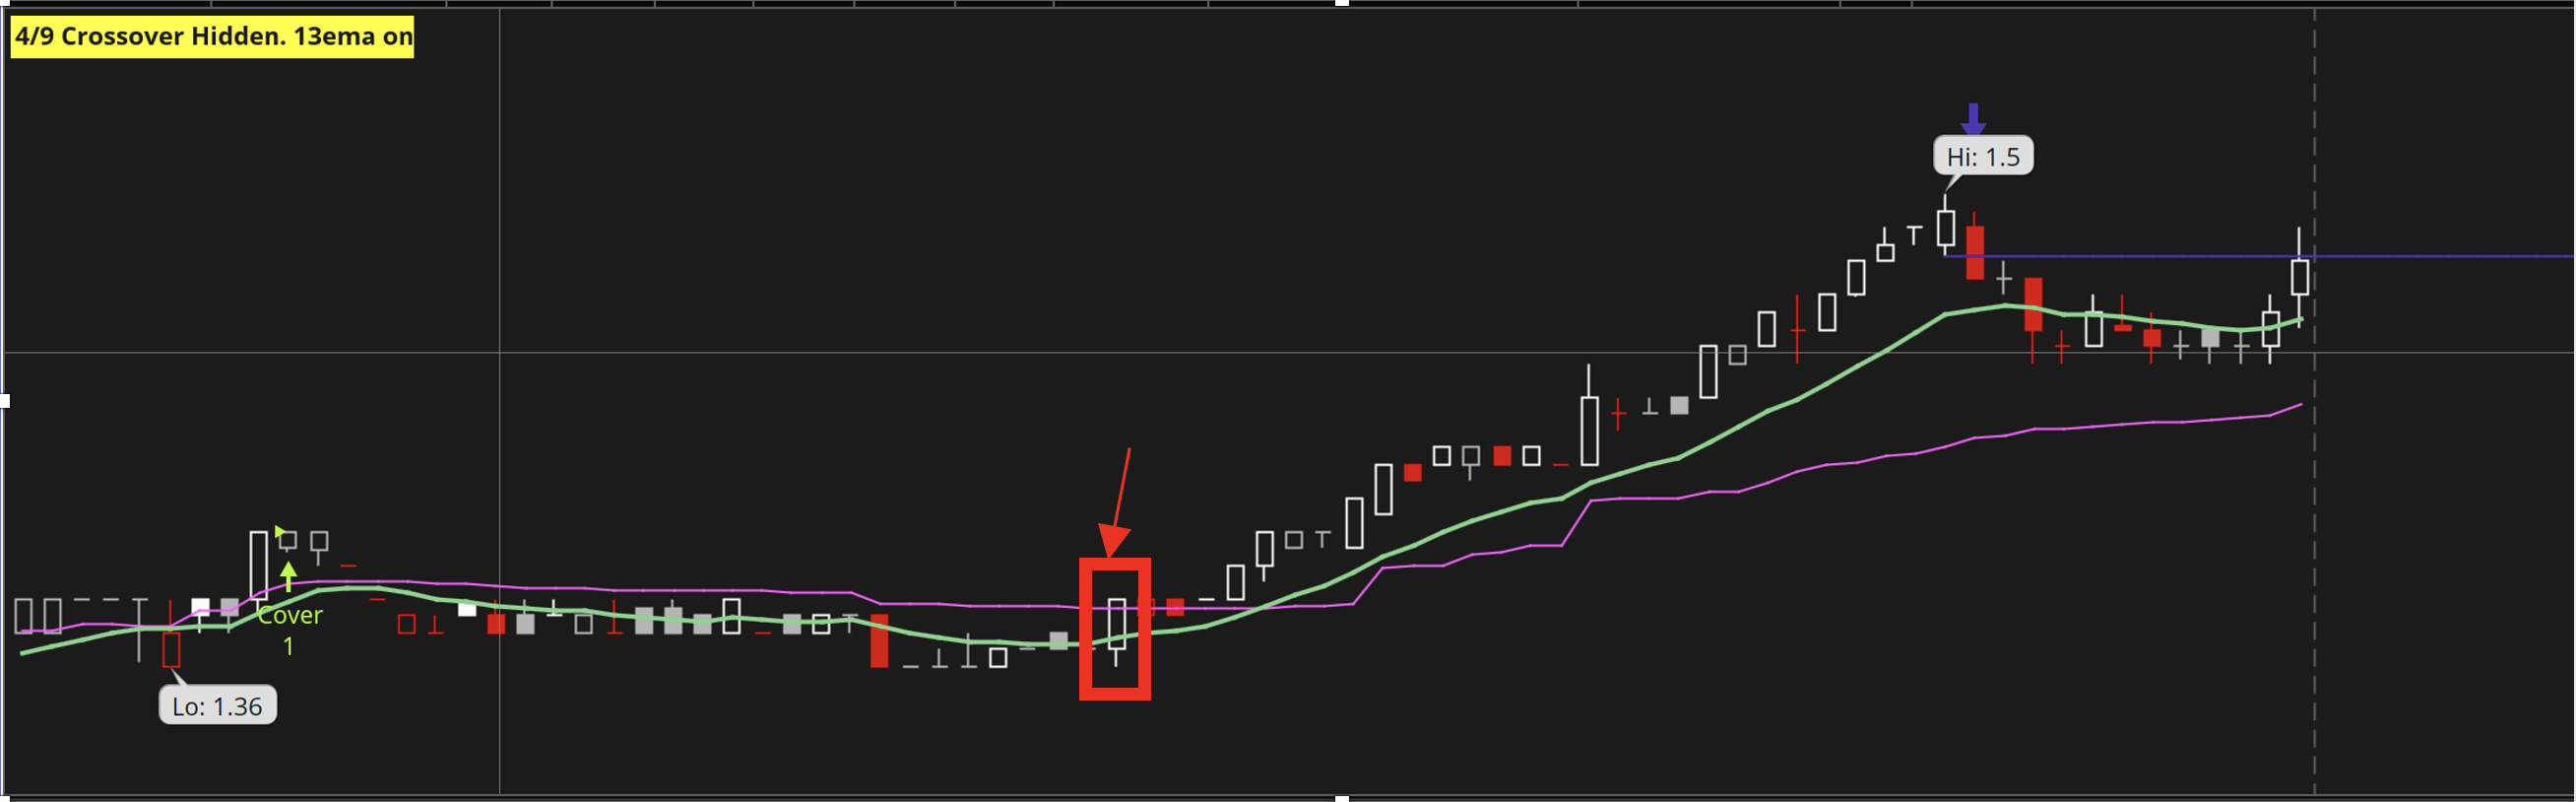
Here is my current chart setup
Aggregation : 5 min
Plots : VWAP
CoppockCurve (using custom script to plot the line on the chart)
Looking for : When the current candle opens below CoppockCurve and Closes above the VWAP should indicate it in the watch list column in a color. In the first image highlighted the condition in RED BOX with arrow.
Uploading the screenshot and scripts used for VWAP and CoppockCurve and the chart. Any help in building the script would be really helpful.
Thank you very much in advance for your time and efforts put in to develop the script.
Thanks,
-Andriod.
Here is my current chart setup
Aggregation : 5 min
Plots : VWAP
CoppockCurve (using custom script to plot the line on the chart)
Looking for : When the current candle opens below CoppockCurve and Closes above the VWAP should indicate it in the watch list column in a color. In the first image highlighted the condition in RED BOX with arrow.
Uploading the screenshot and scripts used for VWAP and CoppockCurve and the chart. Any help in building the script would be really helpful.
Thank you very much in advance for your time and efforts put in to develop the script.
Code:
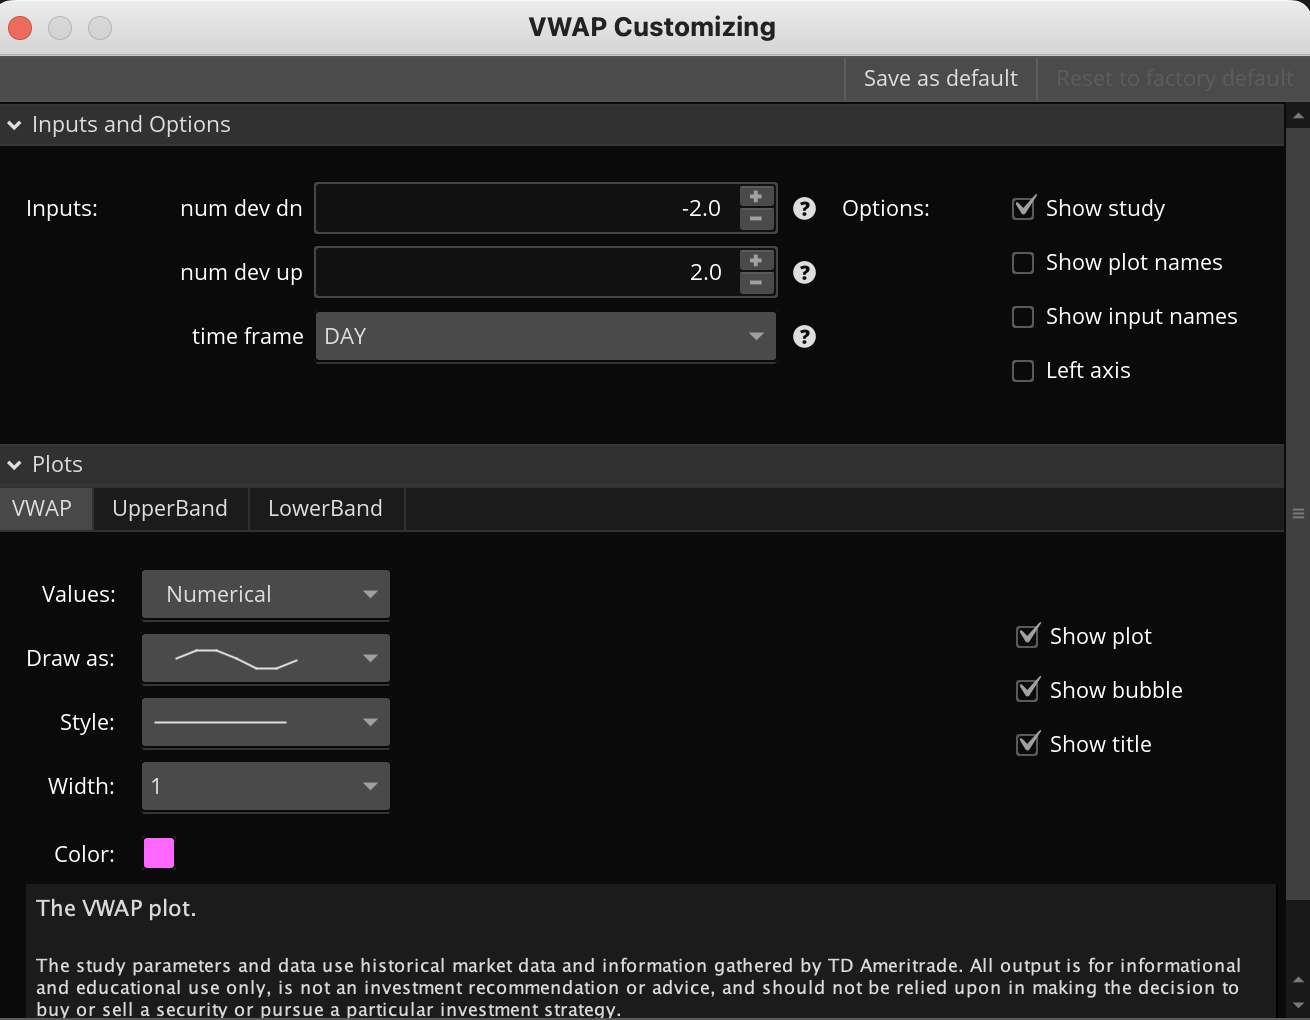
### VWAP code

#
# TD Ameritrade IP Company, Inc. (c) 2011-2023
#

input numDevDn = -2.0;
input numDevUp = 2.0;
input timeFrame = {default DAY, WEEK, MONTH};

def cap = getAggregationPeriod();
def errorInAggregation =
    timeFrame == timeFrame.DAY and cap >= AggregationPeriod.WEEK or
    timeFrame == timeFrame.WEEK and cap >= AggregationPeriod.MONTH;
assert(!errorInAggregation, "timeFrame should be not less than current chart aggregation period");

def yyyyMmDd = getYyyyMmDd();
def periodIndx;
switch (timeFrame) {
case DAY:
    periodIndx = yyyyMmDd;
case WEEK:
    periodIndx = Floor((daysFromDate(first(yyyyMmDd)) + getDayOfWeek(first(yyyyMmDd))) / 7);
case MONTH:
    periodIndx = roundDown(yyyyMmDd / 100, 0);
}
def isPeriodRolled = compoundValue(1, periodIndx != periodIndx[1], yes);

def volumeSum;
def volumeVwapSum;
def volumeVwap2Sum;

if (isPeriodRolled) {
    volumeSum = volume;
    volumeVwapSum = volume * vwap;
    volumeVwap2Sum = volume * Sqr(vwap);
} else {
    volumeSum = compoundValue(1, volumeSum[1] + volume, volume);
    volumeVwapSum = compoundValue(1, volumeVwapSum[1] + volume * vwap, volume * vwap);
    volumeVwap2Sum = compoundValue(1, volumeVwap2Sum[1] + volume * Sqr(vwap), volume * Sqr(vwap));
}
def price = volumeVwapSum / volumeSum;
def deviation = Sqrt(Max(volumeVwap2Sum / volumeSum - Sqr(price), 0));

plot VWAP = price;
plot UpperBand = price + numDevUp * deviation;
plot LowerBand = price + numDevDn * deviation;

VWAP.setDefaultColor(getColor(0));
UpperBand.setDefaultColor(getColor(2));
LowerBand.setDefaultColor(getColor(4));
Code:
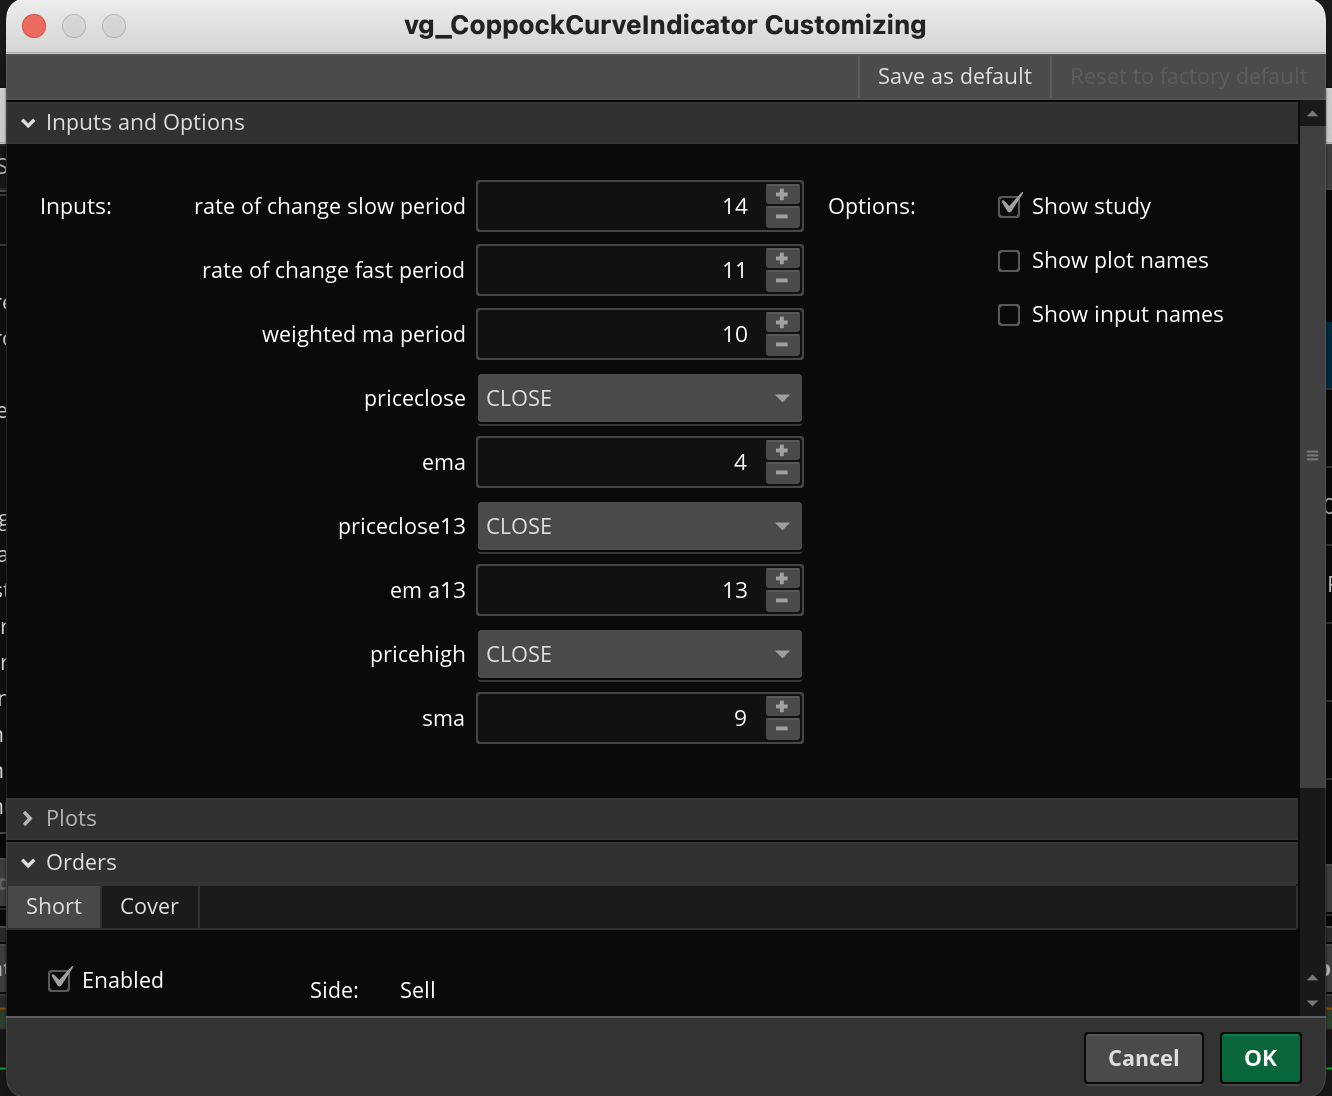
### CoppockCock Curve Indicator script


input RateOfChangeSlowPeriod = 14;
input RateOfChangeFastPeriod = 11;
input WeightedMAPeriod = 10;

def AggregationPeriod = if (getAggregationPeriod() < AggregationPeriod.HOUR) then AggregationPeriod.HOUR else getAggregationPeriod();

def price = close(period = AggregationPeriod);

def ROC1 = if price[RateOfChangeSlowPeriod]!=0 then (price/price[RateOfChangeSlowPeriod]-1)*100 else 0;
def ROC2 = if price[RateOfChangeFastPeriod]!=0 then (price/price[RateOfChangeFastPeriod]-1)*100 else 0;

def Coppock = WMA(ROC1 + ROC2, WeightedMAPeriod);

def ZeroLine = 0;

def BuyNow = Coppock[1] < 0 and Coppock > Coppock[1] and Coppock[1] < Coppock[2];
#plot Buy1 = BuyNow;
#Buy1.SetPaintingStrategy(PaintingStrategy.BOOLEAN_ARROW_UP);
#Buy1.SetLineWeight(1);
#Buy1.AssignValueColor(Color.WHITE);

def SellNow = Coppock[1] > 0 and Coppock < Coppock[1] and Coppock[1] > Coppock[2];
plot Sell1 = SellNow;
Sell1.SetPaintingStrategy(PaintingStrategy.BOOLEAN_ARROW_DoWN);
Sell1.SetLineWeight(1);
Sell1.AssignValueColor(Color.WHITE);

input priceclose = close;
input EMA = 4;
def displaceclose = 0;

input priceclose13 = close;
input EMA13 = 13;
def displaceclose13 = 0;

input pricehigh = close;
input SMA = 9;
def displacehigh = 0;

def AvgExpema = ExpAverage(priceclose[-displaceclose], EMA);
def AvgExpsma = Average(pricehigh[-displacehigh], SMA);
def AvgExp13 = ExpAverage(priceclose13[-displaceclose13], EMA13);

plot ln1 = AvgExp13;
ln1.SetDefaultColor(CreateColor(145, 210, 144));
ln1.SetLineWeight(2);

def US =  AvgExpema crosses above AvgExpsma;
def DS = AvgExpema crosses below AvgExpsma ;

AddOrder(OrderType.SELL_AUTO, condition = Sell1, price = close,1, tickcolor = Color.LIME, arrowcolor = Color.LIME, name = "Short");

AddOrder(OrderType.BUY_AUTO, condition = US, price = close,1, tickcolor = Color.LIME, arrowcolor = Color.LIME, name = "Cover");

AddLabel(yes,"4/9 Crossover Hidden. 13ema on",color.Yellow);
Thanks,
-Andriod.