Coding Help (fold, index and while)

RobertPayne

Member
You will need to use a
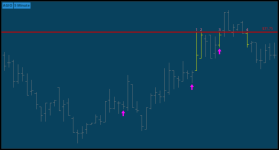
 fold loop in thinkScript. More information on this function is available here: https://tlc.thinkorswim.com/center/reference/thinkScript/Reserved-Words/fold.html

Here's an example.

Ruby:
input length = 60;
def countHighTouches = fold i = 0 to length with internalSum = 0 do if GetValue(high, i) == high then internalSum + 1 else internalSum;
plot arrowUp = counthightouches == 3;
arrowup.setpaintingStrategy(paintingStrategy.BOOLEAN_ARROW_UP);
arrowup.setdefaultColor(color.magenta);
arrowup.setlineWeight(3);

K74Gsn1.png
 

Attachments

  • K74Gsn1.png
    K74Gsn1.png
    20.6 KB · Views: 111
@RobertPayne I looked at your little snippet above, shouldn't we look at GetValue(high, -i) rather than GetValue(high, i)?

Notice the minus sign in front of the variable "i"? I'm pretty sure that would be the case but thought I'd run this by you to confirm.

Here is the revised script if so:

Code:
input length = 60;
def countHighTouches = fold i = 0 to length with internalSum = 0 do if GetValue(high, -i) == high then internalSum + 1 else internalSum;
plot arrowUp = counthightouches == 3;
arrowup.setpaintingStrategy(paintingStrategy.BOOLEAN_ARROW_UP);
arrowup.setdefaultColor(color.magenta);
arrowup.setlineWeight(3);
 
Can someone help with the thinkscript code to do the following? (I am a thinkscript newbie. I see the reference has fold, index, and while examples but don't know how to do program)

Let us assume following sequence of Up or Down points happened for the past 8 (or n) periods.
+1, +2, +3, -1, -2, -3, +4, +5
Bonus (If I can give more weightage to the most recent periods, it would be great)

I want to store in a variable upPoints adding up +1,+2,+3, +4,+5 = 15
I want to store in a variable downPoints adding up -1, -2, -3 = 6

I then want to plot (the ratio) upPoints / downPoint

Thanks a lot.
 
At first glance, you'll need to write a function that filters neg/pos values from the array & set each new array to it's own variable (upPoints, downPoints). Then recursively iterate over each in order to add the values together (similar to the reduce() method in javascript). If i have some time after market today i'll try to post some example code.
 
Thank you @markos

I am sorry, if it is not clear. Here is more explanation.

I am looking to find Divergence of price and this ratio (up-down points) using the following method and back test for results.

I will use it with Daily charts but any period more than 15 mins should provide good results. Candle chart for price and plotting this ratio as a line (just like a moving average).

Let us assume following sequence of Up or Down points happened for the past 8 (or n) periods.
+1, +2, +3, -1, -2, -3, +4, +5

Bonus (If I can give more weightage to the most recent periods, it would be great)

What I wrote below is my crude form of pseudo code. Based on @eddielee394's response, he understood what I want. Only thing is I don't know how to code this piece. If I get some snippets of code, I will be able to put the whole thing together.

I want to store in a variable upPoints adding up +1,+2,+3, +4,+5 = 15
I want to store in a variable downPoints adding up -1, -2, -3 = 6

I then want to get (the ratio) upPoints / downPoint and then plot

I want to then plot this in the lower part of the chart (like an oscillator).

Hope this is better.
 
@venus360 Per your request here is a study that plots the ratio of Up/Down points relative to the prior candle that utilizes the fold() construct. I have used 8 candles(periods) as per your description. Additionally I have verified the accuracy of the results by comparing it with manual computations of a stock like AMZN. The results were identical.

Code:
# UpPoints DownPoints Ratio
# tomsk
# 1.17.2020

# Plots the ratio of Up/Down points relative to the prior candle

declare lower;

def upPoints   = fold i = 0 to 8
                 with p
                 do p + GetValue(if close > close[1] then close - close[1] else 0, i);
def downPoints = fold j = 0 to 8
                 with r
                 do r + GetValue(if close < close[1] then close - close[1] else 0, j);
plot ratio = upPoints / AbsValue(downPoints);

AddLabel(1, "Up Points = " + upPoints, Color.Yellow);
AddLabel(1, "Down Points = " + downPoints, Color.Yellow);
# End UpPoints DownPoints Ratio
 
I am trying to do the following: I have a support level on each and every bar. I want to know what (day/bar) support was breached for a certain number of days held going forward and then place the number of days above the starting bar.

For example lets say on January 29th the SPX Support level was 3240 and lets say the "DaysHeld" equals 5. The study would then check to see if the next bar, 1-30-20, low is less than 3240, if not it goes to the next day, 1-31-20, if the low is less than 3240, (lets say it is) then the DaySupportBroken would equal 2. Then the days it took to break support would be placed on the 1-29-20 bar. ie. a number 2 would be placed above 1-29-20. If no low broke support from 1-29-20 going forward 5 days then then a zero would be placed above 1-29-20

This is what I have:

Code:
input DaysHeld   =  5;
def PivotLevel = MovAvgExponential(low, DaysHeld ) - 96.62 ;  #rigged value to break support
plot PivotLevelPlot =  PivotLevel ;
PivotLevelPlot.SetDefaultColor(Color.CYAN);
PivotLevelPlot.SetLineWeight(2);
PivotLevelPlot.SetPaintingStrategy(PaintingStrategy.DASHES);

def DaySupportBroken   = fold idx = 1 to DaysHeld with s = 0 do if Low < Less than the <startbar>support then tell me what day it broke support else 0;

plot CountDayBroken = DaySupportBroken ;
CountDayBroken SetPaintingStrategy(PaintingStrategy.Values_Above);

Any help would be greatly appreciated.

thanks,
 
I'm using a fold statement and want to have the "to" portion of the loop set to a dynamic number, as opposed to a static one. Like this, where BarsAgoForHigh is calculated previously using a different Fold statement

Def GetLowest = fold j = 0 to BarsAgoForHigh

In other words, BarsAgoForHigh is recalculated every bar, and the fold statement needs to loop that many times

If I set it to a static number, like this, it loops the desired 5 times:

Def GetLowest = fold j = 0 to 5

Here's more specifically what I'm doing. I'm looking for a large upward price swing, followed by price stabilization.

In this example, the stabilization period is 7 days, and the time-frame for the price swing up is 21. So price went up in days 1 through 21, then stabilized in week 4 (days 22-28).

This is the logic:

Starting with 7 days ago, Look back at the prior 21 days to see if there is a jump in price

def HighestHigh = Highest(High[7], 21); # Find the highest high from 7 bars ago back to 28 days ago
def LowestLow = Lowest(Low[7], 21); # Find the highest high from 7 bars ago back to 28 days ago

If there is a price jump, I use a fold loop to calculate how many bars back the highest high was (This variable is called BarsAgoForHigh)

def BarsAgoForHigh = fold i = 0 to 7 with t = 0
do
if high == HighestHigh then
(
t+i
)
else
(
t
);

Then, I use another Fold loop to evaluate what the lowest low is since that high point, which occurred BarsAgoForHigh bars ago. This is where the problem is

def GetLowest = fold j = 0 to BarsAgoForHigh with u = 10000
do
if getvalue(low, j+1) < getvalue(low, j) && getvalue(low, j+1) < u then
(
u*0+ getvalue(low, j+1)

)
else
(
u
);


When BarsAgoForHigh is static (for example, 5), it plots fine
When BarsAgoForHigh is dynamic (as outlined above) it doesn't plot anything (not even other simple plot commands in the study)


The function Lowest(low, BarsAgoForHigh) would be great, however it also does not allow a dynamic length (that's why I turned to Fold loops)

Thank you in advance. I'm just learning this language and find its simplicity can be difficult to work with

side note, is there a way to have an if statement that has multiple then commands lol?

303194d1595374461.jpg
 
Last edited by a moderator:
Hi!
Please help me.
I'm not a coder and this problem took a few days, but I still can't figure out how to transform this code into Tradingview:
Code:
input n = 10;
plot factorial = fold index = 1 to n + 1 with p = 1 do p * index;

Help me please.
Thank you.
 

Join useThinkScript to post your question to a community of 21,000+ developers and traders.

Similar threads

Not the exact question you're looking for?

Start a new thread and receive assistance from our community.

87k+ Posts
333 Online
Create Post

Similar threads

Similar threads

The Market Trading Game Changer

Join 2,500+ subscribers inside the useThinkScript VIP Membership Club
  • Exclusive indicators
  • Proven strategies & setups
  • Private Discord community
  • ‘Buy The Dip’ signal alerts
  • Exclusive members-only content
  • Add-ons and resources
  • 1 full year of unlimited support

Frequently Asked Questions

What is useThinkScript?

useThinkScript is the #1 community of stock market investors using indicators and other tools to power their trading strategies. Traders of all skill levels use our forums to learn about scripting and indicators, help each other, and discover new ways to gain an edge in the markets.

How do I get started?

We get it. Our forum can be intimidating, if not overwhelming. With thousands of topics, tens of thousands of posts, our community has created an incredibly deep knowledge base for stock traders. No one can ever exhaust every resource provided on our site.

If you are new, or just looking for guidance, here are some helpful links to get you started.

What are the benefits of VIP Membership?
VIP members get exclusive access to these proven and tested premium indicators: Buy the Dip, Advanced Market Moves 2.0, Take Profit, and Volatility Trading Range. In addition, VIP members get access to over 50 VIP-only custom indicators, add-ons, and strategies, private VIP-only forums, private Discord channel to discuss trades and strategies in real-time, customer support, trade alerts, and much more. Learn all about VIP membership here.
How can I access the premium indicators?
To access the premium indicators, which are plug and play ready, sign up for VIP membership here.
Back
Top