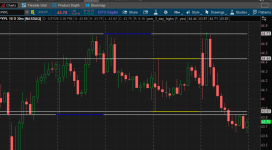
# prev_3_day_highs


# https://usethinkscript.com/threads/code-to-plot-3-high-of-days.22442/
# Code to plot 3 high of days
# hey  5/26

#Would anyone have a code which puts a line of triangles on today's chart at:

#1) The previous day's high of day and low of day

#2) The previous high of day which is even greater than yesterday's high of day (no matter long ago it was) and the previous low of day which is lower than yesterday's low of day (no matter long ago it was) and

#3) The previous high of day which is even greater than the high of day in step two (no matter long ago it was) and the previous low of day which is lower than the low of day in step 2 (no matter long ago it was)?


def na = double.nan;
def bn = barnumber();

def big = 99999;
def gd = getday();
def nd = gd != gd[1];
def ld = gd == GetLastDay();

input day1_day_offest = 1;

#def prevld = !isnan(close(period = aggregationPeriod.DAY)[-1]) and isnan(close(period = aggregationPeriod.DAY)[-2]);
def prevld = !isnan(close(period = aggregationPeriod.DAY)[-day1_day_offest]) and isnan(close(period = aggregationPeriod.DAY)[-(day1_day_offest+1)]);
# addverticalline(prevld,"", color.gray);
#addchartbubble(1, low, d, color.cyan, no);


input show_lines = yes;
addverticalline(show_lines and nd,"", color.gray);
#addlabel(1, chartagg);

#--------------------------


# find day hi & lo on 2nd last day
def hi1;
def hi1bn;
def lo1;
def lo1bn;
def pdbn;
if bn == 1 then {
 hi1 = 0;
 hi1bn = 0;
 lo1 = big;
 lo1bn = 0;
 pdbn = 0;
} else if nd and prevld then {
 hi1 = high;
 hi1bn = bn;
 lo1 = low;
 lo1bn = bn;
 pdbn = bn;
} else if prevld then {
 hi1 = max(hi1[1],high);
 hi1bn = if hi1 != hi1[1] then bn else hi1bn[1];
 lo1 = min(lo1[1], low);
 lo1bn = if lo1 != lo1[1] then bn else lo1bn[1];
 pdbn = pdbn[1];
} else {
 hi1 = hi1[1];
 hi1bn = hi1bn[1];
 lo1 = lo1[1];
 lo1bn = lo1bn[1];
 pdbn = pdbn[1];
}


def hi1x = highestall(hi1);
def hi1bnx = highestall(hi1bn);

def lo1x = lowestall(lo1);
def lo1bnx = highestall(lo1bn);

def pdbnx = highestall(pdbn);


plot zhi1 =  if isnan(close) then na else hi1x;
#zhi1.SetPaintingStrategy(PaintingStrategy.LINE_VS_TRIANGLES);
zhi1.AssignValueColor(if prevld then color.yellow else color.light_gray);
zhi1.setlineweight(2);

plot zlo1 =  if isnan(close) then na else lo1x;
#zlo1.SetPaintingStrategy(PaintingStrategy.LINE_VS_TRIANGLES);
zlo1.AssignValueColor(if prevld then color.yellow else color.light_gray);
zlo1.setlineweight(2);


addchartbubble(0,low,
bn + "\n" +
hi1bnx
, color.cyan, no);


#--------------------------

#  hi2 , before and higher than 1st high
#  lo2 , before and lower than 1st low

def n = 1000;

def hi2off;
def hi2;
def hi2bn;
if bn == 1 then {
 hi2off = fold a = 1 to n
   with b
#   offset , count backwards , from pdbnx , calc from bn1
#   while (getvalue(high, -((pdbnx-1) - a)) < hi1x) and !isnan(getvalue(high, -((pdbnx-1) - a)))
   while (getvalue(high(period = aggregationPeriod.DAY), -((pdbnx-1) - a)) < hi1x) and !isnan(getvalue(high(period = aggregationPeriod.DAY), -((pdbnx-1) - a)))
   do b+1;

# hi2 = getvalue(high, -((pdbnx-1) - (hi2off+1)));
 hi2 = getvalue(high(period = aggregationPeriod.DAY), -((pdbnx-1) - (hi2off+1)));
 hi2bn = 0;

} else {
 hi2off = hi2off[1];
 hi2 = hi2[1];
 hi2bn = 0;
}


def lo2off;
def lo2;
def lo2bn;
if bn == 1 then {
 lo2off = fold c = 1 to n
   with d
#   offset , count backwards , from pdbnx , calc from bn1
#   while (getvalue(high, -((pdbnx-1) - a)) < hi1x) and !isnan(getvalue(high, -((pdbnx-1) - a)))
   while (getvalue(low(period = aggregationPeriod.DAY), -((pdbnx-1) - c)) > lo1x) and !isnan(getvalue(low(period = aggregationPeriod.DAY), -((pdbnx-1) - c)))
   do d+1;

# hi2 = getvalue(high, -((pdbnx-1) - (hi2off+1)));
 lo2 = getvalue(low(period = aggregationPeriod.DAY), -((pdbnx-1) - (lo2off+1)));
 lo2bn = 0;

} else {
 lo2off = lo2off[1];
 lo2 = lo2[1];
 lo2bn = 0;
}


def hi2x = highestall(hi2);
def lo2x = highestall(lo2);

plot zhi2 =  if isnan(close) then na else hi2x;
#zhi2.SetPaintingStrategy(PaintingStrategy.LINE_VS_TRIANGLES);
zhi2.AssignValueColor(if (high(period = aggregationPeriod.DAY) == hi2x) then color.blue else color.light_gray);
zhi2.setlineweight(2);

plot zlo2 =  if isnan(close) then na else lo2x;
#zlo2.SetPaintingStrategy(PaintingStrategy.LINE_VS_TRIANGLES);
zlo2.AssignValueColor(if (low(period = aggregationPeriod.DAY) == lo2x) then color.blue else color.light_gray);
zlo2.setlineweight(2);


#--------------------------

addchartbubble(0, low*0.995,
bn + " bn\n" +
pdbnx + " pbn\n" +
hi2off + " 2o\n" +
hi2 + " 2\n"
, color.cyan, no);


#--------------------------

#