Chris' All-In_One Labels For ThinkOrSwim

MerryDay

Administrative
Staff member
Staff
VIP
Lifetime
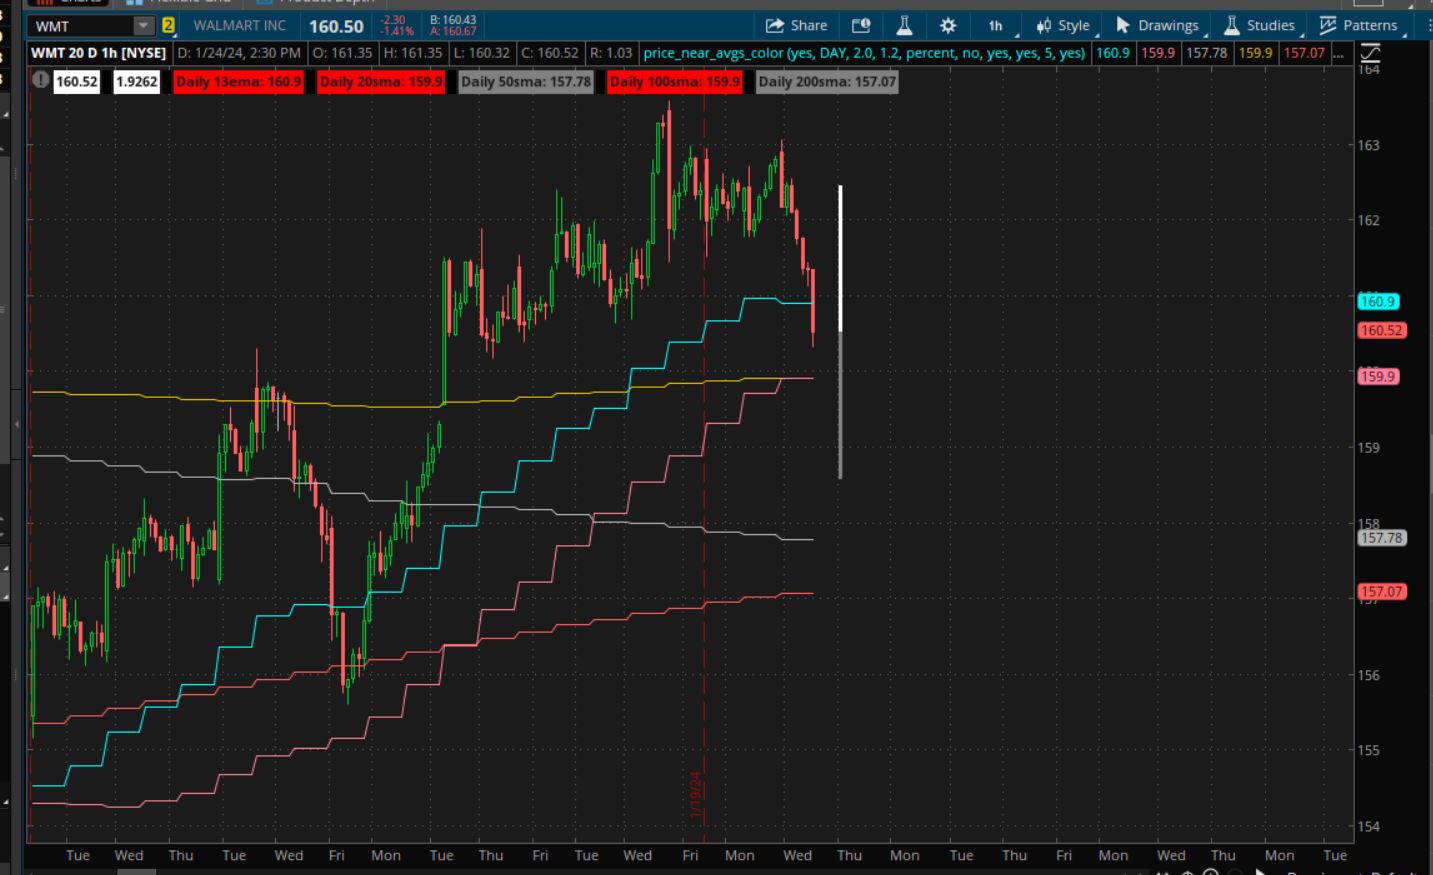
One of the single greatest predictor of whether your trade will be profitable; is verifying that you are making entry at the appropriate point on your trading chart and also in the daily cycle.

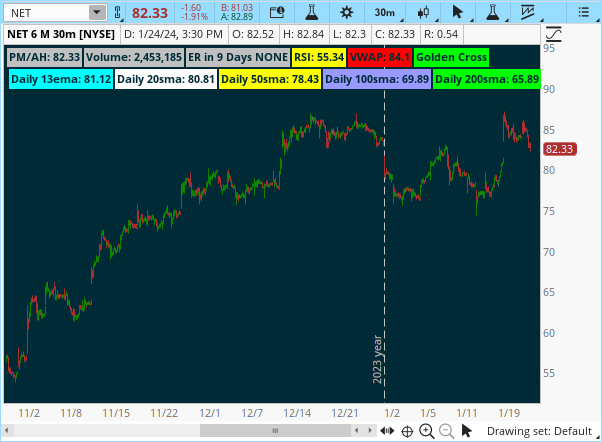
These daily labels provide a view of the state of trend on the daily chart.
shared study link: http://tos.mx/b0Gkjly Click here for --> Easiest way to load shared links
LtpgGCa.png

Ruby:
#################################################
#Chris' All in One Labels
# Heads Up Display
#################################################

# ***************** Define *************************
def LastPrice = close(PriceType = "LAST");
def Daily = close(Period = "day");
def RSI = reference RSI(length = 14, price = close(period = "day" )).RSI;
def VWAP = vwap(Period = "day");
def EMA13Day = ExpAverage(Daily, 13);
def SMA20Day = Average(Daily, 20);
def SMA50Day = Average(Daily, 50);
def SMA100Day = Average(Daily, 100);
def SMA200Day = Average(Daily, 200);
def SMA50Day1 = SMA50Day >= Average(Daily, 200);
def SMA200Day1 = SMA50Day < Average(Daily, 200);
def DailyVol = volume(period = "day");
def AvgVol = (volume(period = ”DAY”)[1] + volume(period = ”DAY”)[2] + volume(period = ”DAY”)[3] + volume(period = ”DAY”)[4] + volume(period = ”DAY”)[5] + volume(period = ”DAY”)[6] + volume(period = ”DAY”)[7] + volume(period = ”DAY”)[8] + volume(period = ”DAY”)[9] + volume(period = ”DAY”)[10]) / 10;
#Earnings Data
def LastEarningsBar = AbsValue(GetEventOffset(Events.EARNINGS, 0));
def NextEarnings = if IsNaN(LastEarningsBar) then 0 else LastEarningsBar;
def ERlength = 30;
def earnings = HasEarnings();
def before = HasEarnings(type = EarningTime.BEFORE_MARKET);
def after =  HasEarnings(type = EarningTime.AFTER_MARKET);
def anytime = HasEarnings();
def before1 = Sum(before, ERlength)[-ERlength + 1] > 0;
def after1 = Sum(after, ERlength)[-ERlength + 1] > 0;
def anytime1 = Sum(anytime, ERlength)[-ERlength + 1] > 0;

# ***************** Labels *************************
input Show_Label_Box = yes;

AddLabel(Show_Label_Box, "PM/AH: " + LastPrice, Color.light_GRAY);
AddLabel(Show_Label_Box, "Volume: " + DailyVol, if DailyVol > AvgVol then Color.GREEN else Color.light_GRAY);
AddLabel(Show_Label_Box, "ER in " + NextEarnings + " Days " + if before1 then "BMO" else if after1 then "AMC" else if anytime1 then "Unknown time" else "NONE", Color.light_GRAY);
AddLabel(Show_Label_Box, "RSI: " + Round(RSI, 2), if RSI > 60 then Color.RED else if RSI < 30 then Color.GREEN else Color.YELLOW);
AddLabel(Show_Label_Box, "VWAP: " + Round(VWAP, 2), if Daily > VWAP then Color.PLUM else Color.RED);
AddLabel(Show_Label_Box, "Golden Cross", if SMA50Day1 then Color.GREEN else Color.RED);
AddLabel(Show_Label_Box, "Daily 13ema: " + Round(EMA13Day, 2), if close > EMA13Day then color.cyan else Color.RED);
AddLabel(Show_Label_Box, "Daily 20sma: " + Round(SMA20Day, 2), if close > SMA20Day then color.white else Color.RED);
AddLabel(Show_Label_Box, "Daily 50sma: " + Round(SMA50Day, 2), if close > SMA50Day then color.yellow else Color.RED);
AddLabel(Show_Label_Box, "Daily 100sma: " + Round(SMA100Day, 2), if close > SMA100Day then color.violet else Color.RED);
AddLabel(Show_Label_Box, "Daily 200sma: " + Round(SMA200Day, 2), if close > SMA200Day then color.green else Color.RED);
 
Last edited:

Join useThinkScript to post your question to a community of 21,000+ developers and traders.

Moving Average Labels Turn Red When Price is Near
Howdy! hope any North Easterners are safe and sound from the storm last night...

I wanted to see if its possible to make these price labels turn red when the price is approaching.
2024-01-10_12h01_54.png


Referencing the picture above, I'd like to see if someone can make these labels perpetually grey but if the real time price comes within .20 (maybe user can input this parameter?) of the moving average it is referencing, then the label(s) turn red.

I have a big cluster of labels I really like using, and I like the concept of these longer term MA's on my chart, but I want to be able to ignore them at a glance and think it would help if they are greyed out/translucent unless prices comes close to it, alerting me of it.

Thanks in advance!

FWIW - I have commented a lot of the labels I don't really need/want, but I do like keeping them there, for future use.

Code:
#Chris' All in One Labels


#################################################
# Heads Up Display
#################################################

# ***************** Define *************************
def LastPrice = close(PriceType = "LAST");
def Daily = close(Period = "day");
def RSI = reference RSI(length = 14, price = close(period = "day" )).RSI;
def VWAP = vwap(Period = "day");
def EMA13Day = ExpAverage(Daily, 13);
def SMA20Day = Average(Daily, 20);
def SMA50Day = Average(Daily, 50);
def SMA100Day = Average(Daily, 100);
def SMA200Day = Average(Daily, 200);
def SMA50Day1 = SMA50Day >= Average(Daily, 200);
def SMA200Day1 = SMA50Day < Average(Daily, 200);
def DailyVol = volume(period = "day");
def AvgVol = (volume(period = ”DAY”)[1] + volume(period = ”DAY”)[2] + volume(period = ”DAY”)[3] + volume(period = ”DAY”)[4] + volume(period = ”DAY”)[5] + volume(period = ”DAY”)[6] + volume(period = ”DAY”)[7] + volume(period = ”DAY”)[8] + volume(period = ”DAY”)[9] + volume(period = ”DAY”)[10]) / 10;
#Earnings Data
def LastEarningsBar = AbsValue(GetEventOffset(Events.EARNINGS, 0));
def NextEarnings = if IsNaN(LastEarningsBar) then 0 else LastEarningsBar;
def ERlength = 30;
def earnings = HasEarnings();
def before = HasEarnings(type = EarningTime.BEFORE_MARKET);
def after =  HasEarnings(type = EarningTime.AFTER_MARKET);
def anytime = HasEarnings();
def before1 = Sum(before, ERlength)[-ERlength + 1] > 0;
def after1 = Sum(after, ERlength)[-ERlength + 1] > 0;
def anytime1 = Sum(anytime, ERlength)[-ERlength + 1] > 0;

# ***************** Labels *************************
input Show_Label_Box = yes;

#AddLabel(Show_Label_Box, "PM/AH: " + LastPrice, Color.GRAY);
#AddLabel(Show_Label_Box, "Volume: " + DailyVol, if DailyVol > AvgVol then Color.GREEN else Color.GRAY);
#AddLabel(Show_Label_Box, "ER in " + NextEarnings + " Days " + if before1 then "BMO" else if after1 then "AMC" else if anytime1 then "Unknown time" else "NONE", Color.GRAY);
#AddLabel(Show_Label_Box, "RSI: " + Round(RSI, 2), if RSI > 60 then Color.RED else if RSI < 30 then Color.GREEN else Color.YELLOW);
#AddLabel(Show_Label_Box, "VWAP: " + Round(VWAP, 2), if Daily > VWAP then Color.PLUM else Color.RED);
#AddLabel(Show_Label_Box, "Golden Cross", if SMA50Day1 then Color.GREEN else Color.RED);
AddLabel(Show_Label_Box, "Daily 13ema: " + Round(EMA13Day, 2), if close > EMA13Day then color.cyan else Color.RED);
AddLabel(Show_Label_Box, "Daily 20sma: " + Round(SMA20Day, 2), if close > SMA20Day then color.white else Color.RED);
AddLabel(Show_Label_Box, "Daily 50sma: " + Round(SMA50Day, 2), if close > SMA50Day then color.yellow else Color.RED);
AddLabel(Show_Label_Box, "Daily 100sma: " + Round(SMA100Day, 2), if close > SMA100Day then color.blue else Color.RED);
AddLabel(Show_Label_Box, "Daily 200sma: " + Round(SMA200Day, 2), if close > SMA200Day then color.green else Color.RED);
 
Last edited by a moderator:
Howdy! hope any North Easterners are safe and sound from the storm last night...

I wanted to see if its possible to make these price labels turn red when the price is approaching.
View attachment 20668

Referencing the picture above, I'd like to see if someone can make these labels perpetually grey but if the real time price comes within .20 (maybe user can input this parameter?) of the moving average it is referencing, then the label(s) turn red.

I have a big cluster of labels I really like using, and I like the concept of these longer term MA's on my chart, but I want to be able to ignore them at a glance and think it would help if they are greyed out/translucent unless prices comes close to it, alerting me of it.

Thanks in advance!

FWIW - I have commented a lot of the labels I don't really need/want, but I do like keeping them there, for future use.

Code:
#Chris' All in One Labels


#################################################
# Heads Up Display
#################################################

# ***************** Define *************************
def LastPrice = close(PriceType = "LAST");
def Daily = close(Period = "day");
def RSI = reference RSI(length = 14, price = close(period = "day" )).RSI;
def VWAP = vwap(Period = "day");
def EMA13Day = ExpAverage(Daily, 13);
def SMA20Day = Average(Daily, 20);
def SMA50Day = Average(Daily, 50);
def SMA100Day = Average(Daily, 100);
def SMA200Day = Average(Daily, 200);
def SMA50Day1 = SMA50Day >= Average(Daily, 200);
def SMA200Day1 = SMA50Day < Average(Daily, 200);
def DailyVol = volume(period = "day");
def AvgVol = (volume(period = ”DAY”)[1] + volume(period = ”DAY”)[2] + volume(period = ”DAY”)[3] + volume(period = ”DAY”)[4] + volume(period = ”DAY”)[5] + volume(period = ”DAY”)[6] + volume(period = ”DAY”)[7] + volume(period = ”DAY”)[8] + volume(period = ”DAY”)[9] + volume(period = ”DAY”)[10]) / 10;
#Earnings Data
def LastEarningsBar = AbsValue(GetEventOffset(Events.EARNINGS, 0));
def NextEarnings = if IsNaN(LastEarningsBar) then 0 else LastEarningsBar;
def ERlength = 30;
def earnings = HasEarnings();
def before = HasEarnings(type = EarningTime.BEFORE_MARKET);
def after =  HasEarnings(type = EarningTime.AFTER_MARKET);
def anytime = HasEarnings();
def before1 = Sum(before, ERlength)[-ERlength + 1] > 0;
def after1 = Sum(after, ERlength)[-ERlength + 1] > 0;
def anytime1 = Sum(anytime, ERlength)[-ERlength + 1] > 0;

# ***************** Labels *************************
input Show_Label_Box = yes;

#AddLabel(Show_Label_Box, "PM/AH: " + LastPrice, Color.GRAY);
#AddLabel(Show_Label_Box, "Volume: " + DailyVol, if DailyVol > AvgVol then Color.GREEN else Color.GRAY);
#AddLabel(Show_Label_Box, "ER in " + NextEarnings + " Days " + if before1 then "BMO" else if after1 then "AMC" else if anytime1 then "Unknown time" else "NONE", Color.GRAY);
#AddLabel(Show_Label_Box, "RSI: " + Round(RSI, 2), if RSI > 60 then Color.RED else if RSI < 30 then Color.GREEN else Color.YELLOW);
#AddLabel(Show_Label_Box, "VWAP: " + Round(VWAP, 2), if Daily > VWAP then Color.PLUM else Color.RED);
#AddLabel(Show_Label_Box, "Golden Cross", if SMA50Day1 then Color.GREEN else Color.RED);
AddLabel(Show_Label_Box, "Daily 13ema: " + Round(EMA13Day, 2), if close > EMA13Day then color.cyan else Color.RED);
AddLabel(Show_Label_Box, "Daily 20sma: " + Round(SMA20Day, 2), if close > SMA20Day then color.white else Color.RED);
AddLabel(Show_Label_Box, "Daily 50sma: " + Round(SMA50Day, 2), if close > SMA50Day then color.yellow else Color.RED);
AddLabel(Show_Label_Box, "Daily 100sma: " + Round(SMA100Day, 2), if close > SMA100Day then color.blue else Color.RED);
AddLabel(Show_Label_Box, "Daily 200sma: " + Round(SMA200Day, 2), if close > SMA200Day then color.green else Color.RED);


5 labels that display 5 average prices.
choose a 'near' value , either a % or a $ value.
if price is within a near value of an average, the average label is red, else gray.

can choose to turn labels red or gray when near, or stay at other colors.

added a colored vertical column , after the last bar, to represent the near range, above and below, the current price.

can turn off the average lines.
average lines default are 2nd agg data from DAY. can change the time frame.


Code:
#price_near_avgs_color

#https://usethinkscript.com/threads/moving-average-labels-turn-red-when-price-is-near.17667/
#Moving Average Labels Turn Red When Price is Near
# Thread starterkhpro59  Start dateJan 10, 2024

#Howdy! hope any North Easterners are safe and sound from the storm last night...

#I wanted to see if its possible to make these price labels turn red when the price is approaching.

#Referencing the picture above, I'd like to see if someone can make these labels perpetually grey but if the real time price comes within .20 (maybe user can input this parameter?) of the moving average it is referencing, then the label(s) turn red.

#I have a big cluster of labels I really like using, and I like the concept of these longer term MA's on my chart, but I want to be able to ignore them at a glance and think it would help if they are greyed out/translucent unless prices comes close to it, alerting me of it.

#FWIW - I have commented a lot of the labels I don't really need/want, but I do like keeping them there, for future use.


#Chris' All in One Labels

def na = double.nan;
def bn = barnumber();

DefineGlobalColor("near", color.red);
DefineGlobalColor("not_near", Color.gray);
#GlobalColor("near");

input red_when_near_avg = yes;


#################################################
# Heads Up Display
#################################################

# ***************** Define *************************
def LastPrice = close(PriceType = "LAST");
input agg = aggregationperiod.day;
def Daily = close(Period = agg);
def RSI = reference RSI(length = 14, price = close(period = agg )).RSI;
def VWAP = vwap(Period = agg);
def EMA13Day = ExpAverage(Daily, 13);
def SMA20Day = Average(Daily, 20);
def SMA50Day = Average(Daily, 50);
def SMA100Day = Average(Daily, 100);
def SMA200Day = Average(Daily, 200);

#def SMA50Day1 = SMA50Day >= Average(Daily, 200);
#def SMA200Day1 = SMA50Day < Average(Daily, 200);
#def DailyVol = volume(period = "day");
#def AvgVol = (volume(period = ”DAY”)[1] + volume(period = ”DAY”)[2] + volume(period = ”DAY”)[3] + volume(period = ”DAY”)[4] + volume(period = ”DAY”)[5] + volume(period = ”DAY”)[6] + volume(period = ”DAY”)[7] + volume(period = ”DAY”)[8] + volume(period = ”DAY”)[9] + volume(period = ”DAY”)[10]) / 10;
#Earnings Data
#def LastEarningsBar = AbsValue(GetEventOffset(Events.EARNINGS, 0));
#def NextEarnings = if IsNaN(LastEarningsBar) then 0 else LastEarningsBar;
def ERlength = 30;
def earnings = HasEarnings();
def before = HasEarnings(type = EarningTime.BEFORE_MARKET);
def after =  HasEarnings(type = EarningTime.AFTER_MARKET);
def anytime = HasEarnings();
def before1 = Sum(before, ERlength)[-ERlength + 1] > 0;
def after1 = Sum(after, ERlength)[-ERlength + 1] > 0;
def anytime1 = Sum(anytime, ERlength)[-ERlength + 1] > 0;


input near_dollars = 2.0;
input near_percent = 1.2;

# choose near type
input near_type = { default dollars , percent };
def near;
switch(near_type) {
case dollars:
  near = near_dollars;
case percent:
  near = (close * (near_percent/100));
}

# is price near an average?
def near13 = absvalue(close - EMA13Day) <= near;
def near20 = absvalue(close - sma20Day) <= near;
def near50 = absvalue(close - sma50Day) <= near;
def near100 = absvalue(close - sma100Day) <= near;
def near200 = absvalue(close - sma200Day) <= near;


input test1 = no;
addchartbubble(test1, low,
 near13 + "\n" +
 near20 + "\n" +
 near50 + "\n" +
 near100 + "\n" +
 near200 + "\n"
, color.yellow, no);


input show_avg_lines = yes;
plot z13 = if show_avg_lines then EMA13Day else na;
plot z20 = if show_avg_lines then sma20Day else na;
plot z50 = if show_avg_lines then sma50Day else na;
plot z100 = if show_avg_lines then sma100Day else na;
plot z200 = if show_avg_lines then sma200Day else na;


# ***************** Labels *************************

input Show_Labels = yes;

#AddLabel(Show_Label_Box, "PM/AH: " + LastPrice, Color.GRAY);
#AddLabel(Show_Label_Box, "Volume: " + DailyVol, if DailyVol > AvgVol then Color.GREEN else Color.GRAY);
#AddLabel(Show_Label_Box, "ER in " + NextEarnings + " Days " + if before1 then "BMO" else if after1 then "AMC" else if anytime1 then "Unknown time" else "NONE", Color.GRAY);
#AddLabel(Show_Label_Box, "RSI: " + Round(RSI, 2), if RSI > 60 then Color.RED else if RSI < 30 then Color.GREEN else Color.YELLOW);
#AddLabel(Show_Label_Box, "VWAP: " + Round(VWAP, 2), if Daily > VWAP then Color.PLUM else Color.RED);
#AddLabel(Show_Label_Box, "Golden Cross", if SMA50Day1 then Color.GREEN else Color.RED);


#AddLabel(Show_Label_Box, "Daily 13ema: " + Round(EMA13Day, 2), if close > EMA13Day then color.cyan else Color.RED);
#AddLabel(Show_Label_Box, "Daily 20sma: " + Round(SMA20Day, 2), if close > SMA20Day then color.white else Color.RED);
#AddLabel(Show_Label_Box, "Daily 50sma: " + Round(SMA50Day, 2), if close > SMA50Day then color.yellow else Color.RED);
#AddLabel(Show_Label_Box, "Daily 100sma: " + Round(SMA100Day, 2), if close > SMA100Day then color.blue else Color.RED);
#AddLabel(Show_Label_Box, "Daily 200sma: " + Round(SMA200Day, 2), if close > SMA200Day then color.green else Color.RED);


#red_when_near_avg
addlabel(Show_Labels, close, color.white);
addlabel(Show_Labels, " ", color.black);
addlabel(Show_Labels, near, color.white);
addlabel(Show_Labels, " ", color.black);
AddLabel(Show_Labels, "Daily 13ema: " + Round(EMA13Day, 2), if !red_when_near_avg then color.cyan else if near13 then GlobalColor("near") else GlobalColor("not_near"));
addlabel(Show_Labels, " ", color.black);
AddLabel(Show_Labels, "Daily 20sma: " + Round(SMA20Day, 2), if !red_when_near_avg then color.white else if near20 then GlobalColor("near") else GlobalColor("not_near"));
addlabel(Show_Labels, " ", color.black);
AddLabel(Show_Labels, "Daily 50sma: " + Round(SMA50Day, 2), if !red_when_near_avg then color.yellow else if near50 then GlobalColor("near") else GlobalColor("not_near"));
addlabel(Show_Labels, " ", color.black);
AddLabel(Show_Labels, "Daily 100sma: " + Round(SMA100Day, 2), if !red_when_near_avg then color.blue else if near100 then GlobalColor("near") else GlobalColor("not_near"));
addlabel(Show_Labels, " ", color.black);
AddLabel(Show_Labels, "Daily 200sma: " + Round(SMA200Day, 2), if !red_when_near_avg then color.green else if near200 then GlobalColor("near") else GlobalColor("not_near"));


# draw +-near range column, after last bar
def cls2 = if isnan(close) then cls2[1] else close;
input offset = 5;
def xoff = (!isnan(close[offset]) and isnan(close[offset-1]));

input show_near_column = yes;
def dcls = close[offset];
def dhi = if xoff and show_near_column then (dcls + near[offset]) else na;
def dlo = if xoff and show_near_column then (dcls - near[offset]) else na;

# column top half / bottom half
AddChart(high = dhi, low = dcls, open = dhi, close = dcls, type = ChartType.CANDLE, growcolor = color.white);
AddChart(high = dcls, low = dlo, open = dcls, close = dlo, type = ChartType.CANDLE, growcolor = color.gray);

# --------------------------------------

addchartbubble(0, cls2,
dcls + "\n" +
xoff + "\n" +
dhi + "\n" +
dlo
, color.yellow, no);

#

WMT hour
labels show, close , near value , 5 averages , 3 of them near and red
qwWekMy.jpg

Thank you so very much! Your work is greatly appreciated. I will test this out tonight, thanks for helping me with this! Learned a bunch of new lines of code from your post, much, much appreciated.

Edit: By the way... love the "Near Column" such a nice touch! Looks great and exactly what I wanted! Thank you sir
Working exactly as described, thanks again. I also want to thank you for the label little line of code that has never crossed my mind..... " " color black idea to separate labels. used it on the rest of mine so I can visualize them faster into different facets of datasets. Thanks @halcyonguy

1706815230454.png
 

Similar threads

Not the exact question you're looking for?

Start a new thread and receive assistance from our community.

87k+ Posts
353 Online
Create Post

Similar threads

Similar threads

The Market Trading Game Changer

Join 2,500+ subscribers inside the useThinkScript VIP Membership Club
  • Exclusive indicators
  • Proven strategies & setups
  • Private Discord community
  • ‘Buy The Dip’ signal alerts
  • Exclusive members-only content
  • Add-ons and resources
  • 1 full year of unlimited support

Frequently Asked Questions

What is useThinkScript?

useThinkScript is the #1 community of stock market investors using indicators and other tools to power their trading strategies. Traders of all skill levels use our forums to learn about scripting and indicators, help each other, and discover new ways to gain an edge in the markets.

How do I get started?

We get it. Our forum can be intimidating, if not overwhelming. With thousands of topics, tens of thousands of posts, our community has created an incredibly deep knowledge base for stock traders. No one can ever exhaust every resource provided on our site.

If you are new, or just looking for guidance, here are some helpful links to get you started.

What are the benefits of VIP Membership?
VIP members get exclusive access to these proven and tested premium indicators: Buy the Dip, Advanced Market Moves 2.0, Take Profit, and Volatility Trading Range. In addition, VIP members get access to over 50 VIP-only custom indicators, add-ons, and strategies, private VIP-only forums, private Discord channel to discuss trades and strategies in real-time, customer support, trade alerts, and much more. Learn all about VIP membership here.
How can I access the premium indicators?
To access the premium indicators, which are plug and play ready, sign up for VIP membership here.
Back
Top