Lesnewby
Member
@chewie76 (Here is the "clean" or "recent" version. http://tos.mx/M4MDAxW}
Does this new clean version repaint?
Does this new clean version repaint?
Join useThinkScript to post your question to a community of 21,000+ developers and traders.
@chewie76 (Here is the "clean" or "recent" version. http://tos.mx/M4MDAxW}
Does this new clean version repaint?
Chewie, great work. Thank You so much for sharing with us. I am not clear about #3 Setup, "Break of SuperTrend Indicator. Do you mind further explaining this? I tried going into the code to figure it out but since I am not a coder I couldnt do it. Last computer class was either Cobol or Fortran with punch cards.I assembled this indicator that includes a few combined indicators based on watching this video.I changed a few of the settings however. This is a trading system or strategy that includes where to enter a trade, where to place your stop loss, and 5 targets, and when to close your trade. There is a real "strategy" below that can be loaded as well to view actual profit/loss. Many thanks to the other contributors who created these indicators. NOTE: I know some people love a clean chart and will say that this is too messy. I understand that. You can uncheck viewing any of the plots within the indicator, like certain target lines you don't want to see or anything else if you prefer.
I added "Quantity" as an input for you to see how much money you are risking and how much money you will get at each target level.
"Quantity" is the number of futures contracts or number of shares of stock you are trading.
Ok, let's carry on. Below is first the trading system summary, and a bunch of chart examples.
SUMMARY OF TRADING SYSTEM:
1.The best trades are in the direction of the 200 EMA (white line). Important point that is why it is #1. Always check first where is the white line 200 EMA.
2. SETUP: You must see three things to define an entry position.
1. A top or bottom reversal signal of the Hull Moving Avg plotted with a white square (top) or white triangle (bottom).
2. Lower Donchian Trend Ribbon either green or red in the color of the direction you are entering the trade. (Shout out to @halcyonguy who converted this into TOS. Much appreciated, you are awesome!!!)
3. Break of the Super Trend indicator. (Default setting is 2.75. Feel free to adjust this if you want in the settings)
4. Stop Loss is placed at or just below the reversal Hull Moving Avg square or triangle. (In some instances, the 200 EMA could be your stop loss.)
3. The first thing that you should expect to see when all 3 triggers are set is when price breaks through the Super Trend, there is sometimes resistance at the first magenta dashed line. This is half of the 1st target. That could be your first trade with trade orders set in place prior to seeing the 3 triggers take effect. Sometimes it is safer to watch price break through the Super Trend, retrace back below, and enter at the entry line as it breaks through the second time.
4. Once price hits the dashed magenta line, it typically either continues in a strong move, or it will come back to the entry line or below. A secondary move will typically push past the magenta line to the next 1x yellow dashed target.
5.Once price hits the first 1x target, it will typically either continue to the 2x target, or retrace back to the 1x or Entry line. 2x target is the goal, but sometimes price will blast to 3x or 4x target.
6.There are times when price will extend beyond the 4x target.
7.The Hull reversal point (white square or triangle) will have a line drawn which is the stop loss. This level is sometimes used as support or resistance, so take note of this area and how price reacts to it.
8.Included is a DYNO regression average that will color the candles green when price is above, red when price is below and yellow when price is between the two lines. Regression bands are also displayed and can be turned on/off in the settings. Your trade should correspond to the color of the candles. Long trade = green candles, short trade = red candles.
9.TRADE EXIT: Place your exit order at any of the target levels of your choice. If price goes beyond the first magenta line, consider moving your stop loss to the entry line (break even), or to the magenta line. You could also move your stop loss to either trail with the Super Trend, or with the Hull moving average. Typically breaking the Hull moving average closes the trade.
This indicator includes labels for the Super Trend, Hull avg, and Dyno regression average. These labels can be turned on/off in the settings.
This indicator includes bubbles for target levels and bubbles for trade entry and stop loss. Bubbles are off by default. These bubbles can be turned on/off in the settings.
This indicator includes various alerts for when Super Trend breaks, when the Hull avg creates a reversal buy/sell signal, and when price crosses the regression bands. These alerts can be turned on/off in the settings.
All example charts are on the 4 minute timeframe. I like the 4 min. Different timeframes will obviously give you different results. Let's get to it!

In the above chart, you have all 3 conditions trigger in the same red candle. 1. Hull reversal point, 2. Red color Donchian Trend Ribbon, 3. Break below of the cyan Super Trend. Take note on how price first hits the magenta dashed line and retraces beyond the Entry Line. It hits the 1X target and continues all the way to 4X target. If you didn't take the 4x target, price breaking the Hull moving average indicates time to close the trade.

In the above chart, there are two trades long and short. Look for all 3 conditions to trigger. 1. Hull reversal point, 2. color Donchian Trend Ribbon, 3. Break of the Super Trend. In the first trade, price goes above the 200 EMA and hits the 2x target. Closing below the Hull average would close the trade. In the second trade, price hits 3x target, and breaking the Hull avg would close the trade.

In the above chart, there is a slight downward slope of the 200 EMA, the top Hull reversal plots, Donchian Trend Ribbon is red, you are looking to short at the break of the Super Trend. It rapidly goes to the 4x target and breaks the Hull avg closing the trade.

In the above chart, all 3 trade setups take place to enter the trade. Price retraces back to the 200 EMA which is above your stop loss. It then continues higher to 4x target. Either have an exit order at the 4x level, or trail stop loss with Super Trend or the yellow Dyno average.

In the above chart, all 3 trade setups take place to enter the trade. Price retraces back to the 200 EMA which is above your stop loss. It then continues higher to beyond the 4x target. You must take your profits. Don’t be greedy.

In the above chart, all 3 trade setups take place to enter the trade. Price is below the 200 EMA and you short. Here is a tricky situation. It barely breaks the Super Trend. It hits your stop loss, but never closes above your stop loss. It then goes to tag the 3x target. Better to be safe and have your stop loss hit, or have a wider stop loss at the 200 EMA.

In the above chart, all 3 trade setups take place to enter the trade. Price is below the 200 EMA and you think it could tag it. Price stays above the Hull avg and hits both the 4x target and the 200 EMA. Be cautious because typically you want to trade in the direction of the 200, but when price is far from it, there is a chance it will come back to it.

In the above chart, all 3 trade setups take place to enter the trade. Price previously is rejected at the 200 EMA and it is rejected a second time. You take the short setup. Price stays below the Hull avg and hits the 3x target. If you didn’t get out at the 3x, you would exit the trade at the break of the Hull avg. Nice trade!

In the above chart, all 3 trade setups take place to enter the trade. Price breaks above the 200 EMA at your entry. 2x target is hit and price breaks the Hull avg. Good time to take profits, or trail your stop at the Super Trend and take profit at the 4x target.

I created a strategy, however, it does not incorporate the lower Donchian Trend Ribbon. It also exits trades if it hits levels and breaks back, so it’s pretty conservative. On the 4 min chart, ES would have a profit of $33,234 in the last 30 days.
And now for the codes.
SHAREABLE LINKS:
Upper Indicator Code: http://tos.mx/sxtzndQ
Donchian Trend Ribbon Indicator Code: http://tos.mx/MMxMs6u This can also be found at this post. https://usethinkscript.com/threads/donchian-trend-ribbon-for-thinkorswim.10861/#post-95366
Note: the Donchian Trend Ribbon has a lower histogram. When the lower histogram is magenta color, it is sign of major selling. When cyan, it is major buying, when it is dark green or dark red, it is in consolidation.
Strategy Code: NOTE: Strategy does not take into account the Hull Avg or the Donchian Ribbon, only the Super Trend break and the target levels. http://tos.mx/neHVQml
Code:#Hull_SuperTrend_Trading_System # assembled by Chewie 4/10/2022 # many thanks to all the other noted contributors to this system. # SuperTrend Yahoo Finance Replica - Modified from Modius SuperTrend # Modified Modius ver. by RConner7 # Modified by Barbaros to replicate look from TradingView version # Modified by Barbaros to add EMA cross for bubbles and alerts # Modified by Barbaros to update bar color painting # v3.3 input Quantity = 1; input Target_Bubbles = no; input Entry_SL_Bubbles = no; input Targetlines = yes; input Labels = yes; input alertON = yes; input Bands = yes; input AvgType = AverageType.HULL; input STAtrMult = 2.75; input nATR = 12; def Point = (Quantity / ticksize()) * tickvalue(); def ATR = ATR("length" = nATR, "average type" = AvgType); def UP_Band_Basic = HL2 + (STAtrMult * ATR); def LW_Band_Basic = HL2 + (-STAtrMult * ATR); def UP_Band = if ((UP_Band_Basic < UP_Band[1]) or (close[1] > UP_Band[1])) then UP_Band_Basic else UP_Band[1]; def LW_Band = if ((LW_Band_Basic > LW_Band[1]) or (close[1] < LW_Band[1])) then LW_Band_Basic else LW_Band[1]; def ST = if ((ST[1] == UP_Band[1]) and (close < UP_Band)) then UP_Band else if ((ST[1] == UP_Band[1]) and (close > Up_Band)) then LW_Band else if ((ST[1] == LW_Band[1]) and (close > LW_Band)) then LW_Band else if ((ST[1] == LW_Band) and (close < LW_Band)) then UP_Band else LW_Band; plot Long = if close > ST then ST else Double.NaN; Long.AssignValueColor(Color.cyan); Long.SetLineWeight(3); plot Short = if close < ST then ST else Double.NaN; Short.AssignValueColor(Color.magenta); Short.SetLineWeight(3); def LongTrigger = isNaN(Long[1]) and !isNaN(Long); def ShortTrigger = isNaN(Short[1]) and !isNaN(Short); plot LongDot = if LongTrigger then ST else Double.NaN; LongDot.SetPaintingStrategy(PaintingStrategy.POINTS); LongDot.AssignValueColor(Color.cyan); LongDot.SetLineWeight(4); plot ShortDot = if ShortTrigger then ST else Double.NaN; ShortDot.SetPaintingStrategy(PaintingStrategy.POINTS); ShortDot.AssignValueColor(Color.magenta); ShortDot.SetLineWeight(4); AddChartBubble(Entry_SL_Bubbles and LongTrigger, ST, "BUY", Color.GREEN, no); AddChartBubble(Entry_SL_Bubbles and ShortTrigger, ST, "SELL", Color.RED, yes); #Super Trend Labels AddLabel(yes and labels and Long, "ST:LONG", color.CYAN); AddLabel(yes and labels and Short, "ST:SHORT", color.magenta); # # Hull Moving Average Concavity and Turning Points # # Author: Seth Urion (Mahsume) # Version: 2020-05-01 V4 # # Now with support for ToS Mobile # declare upper; input HMA_Length = 60; input lookback = 3; input arrows = no; def price = HL2; plot HMA = HullMovingAvg(price = price, length = HMA_Length); def delta = HMA[1] - HMA[lookback + 1]; def delta_per_bar = delta / lookback; def next_bar = HMA[1] + delta_per_bar; def concavity = if HMA > next_bar then 1 else -1; plot turning_point = if concavity[1] != concavity then HMA else double.nan; HMA.AssignValueColor(color = if concavity[1] == -1 then if HMA > HMA[1] then color.dark_orange else color.red else if HMA < HMA[1] then color.dark_green else color.green); HMA.SetLineWeight(3); input ColorON = yes; def Long_StateH = close > HMA; def Short_StateH = close < HMA; # Coloring Bars AssignPriceColor(if ColorON and Long_StateH then Color.GREEN else if ColorON and Short_StateH then Color.RED else Color.current); turning_point.SetLineWeight(2); turning_point.SetPaintingStrategy(paintingStrategy = PaintingStrategy.POINTS); turning_point.SetDefaultColor(color.white); plot MA_Max = if HMA[-1] < HMA and HMA > HMA[1] then HMA else Double.NaN; MA_Max.SetDefaultColor(Color.WHITE); MA_Max.SetPaintingStrategy(PaintingStrategy.SQUARES); MA_Max.SetLineWeight(5); plot MA_Min = if HMA[-1] > HMA and HMA < HMA[1] then HMA else Double.Nan; MA_Min.SetDefaultColor(Color.WHITE); MA_Min.SetPaintingStrategy(PaintingStrategy.TRIANGLES); MA_Min.SetLineWeight(5); def BuySetup = HMA > HMA[1] and HMA[1] < HMA[2]; def SellSetup = HMA < HMA[1] and HMA[1] > HMA[2]; plot sell = if arrows and turning_point and concavity == -1 then high else double.nan; sell.SetDefaultColor(Color.DARK_ORANGE); sell.SetPaintingStrategy(PaintingStrategy.ARROW_DOWN); sell.SetLineWeight(3); plot buy = if arrows and turning_point and concavity == 1 then low else double.nan; buy.SetDefaultColor(Color.CYAN); buy.SetPaintingStrategy(PaintingStrategy.ARROW_UP); buy.SetLineWeight(3); def divergence = HMA - next_bar; ################### # # 2020-05-01 # # MOBILE TOS SUPPORT # # Each color of the HMA needs to be a separate plot as ToS Mobile # lacks the ability to assign colors the way ToS Desktop does. # I recommend a plain colored HMA behind the line # Set the line color of the HMA above to gray or some neutral # # CCD_D -> ConCave Down and Decreasing # CCD_I -> ConCave Down and Increasing # CCU_D -> ConCave Up and Decreasing # CCU_I -> ConCave Up and Increasing # ################### plot CCD_D = if concavity == -1 and HMA < HMA[1] then HMA else double.nan; CCD_D.SetDefaultColor(Color.RED); CCD_D.SetLineWeight(1); plot CCD_I = if concavity == -1 and HMA >= HMA[1] then HMA else double.nan; CCD_I.SetDefaultColor(Color.DARK_ORANGE); CCD_I.SetLineWeight(1); plot CCU_D = if concavity == 1 and HMA <= HMA[1] then HMA else double.nan; CCU_D.SetDefaultColor(COLOR.DARK_GREEN); CCU_D.SetLineWeight(1); plot CCU_I = if concavity == 1 and HMA > HMA[1] then HMA else double.nan; CCU_I.SetDefaultColor(COLOR.GREEN); CCU_I.SetLineWeight(1); #Hull Label AddLabel(yes and labels and CCD_D, "HULL:SELL", color.RED); AddLabel(yes and labels and CCU_I, "HULL:BUY", color.green); AddLabel(yes and labels and CCU_D, "HULL:WEAK SELL", color.dark_green); AddLabel(yes and labels and CCD_I, "HULL:WEAK BUY", color.DARK_ORANGE); #Target lines # created by chewie #Long Entry rec line4 = if IsNaN(short) then line4[1] else short[0]; plot L_Entry = if IsNaN(short) then line4 else double.nan; L_Entry.setpaintingStrategy(paintingStrategy.LINE); L_Entry.setlineWeight(3); L_Entry.setdefaultColor(color.green); L_Entry.hideBubble(); def LE =(if isNaN(L_Entry[1]) then L_Entry else Double.NaN); addchartBubble(Entry_SL_Bubbles and L_Entry, LE,"L/E",color.GREEN); #Long Stoploss rec line = if IsNaN(MA_Min) then line[1] else MA_Min[0]; plot L_stoploss= if isnan(MA_Min) then line else double.nan; L_stoploss.setpaintingStrategy(paintingStrategy.LINE); L_stoploss.setlineWeight(3); L_stoploss.setdefaultColor(color.dark_green); L_stoploss.hideBubble(); def LSL =(if isNaN(L_stoploss[1]) then L_stoploss else Double.NaN); addchartBubble(Entry_SL_Bubbles and L_stoploss, LSL,"L/SL : -" + AsDollars((L_Entry - L_stoploss) * Point),color.DARK_GREEN); #Short Entry rec line3 = if IsNaN(long) then line3[1] else long[0]; plot S_Entry = if IsNaN(long) then line3 else double.nan; S_Entry.setpaintingStrategy(paintingStrategy.LINE); S_Entry.setlineWeight(3); S_Entry.setdefaultColor(color.red); S_Entry.hideBubble(); def SE =(if isNaN(S_Entry[1]) then S_Entry else Double.NaN); addchartBubble(Entry_SL_Bubbles and S_Entry, SE,"S/E",color.RED,0); #Short Stoploss rec line2 = if IsNaN(MA_Max) then line2[1] else MA_Max[0]; plot S_stoploss = if IsNaN(MA_MAX) then line2 else double.nan; S_stoploss.setpaintingStrategy(paintingStrategy.LINE); S_stoploss.setlineWeight(3); S_stoploss.setdefaultColor(color.dark_red); S_stoploss.hideBubble(); def SSL =(if isNaN(S_stoploss[1]) then S_stoploss else Double.NaN); addchartBubble(Entry_SL_Bubbles and S_stoploss, SSL,"S/SL :-" + AsDollars((S_Stoploss - S_Entry) * Point),color.DARK_RED); #HalfX Long plot x1a_Long = if Targetlines then (L_Entry +(L_Entry - L_Stoploss)/2) else double.nan; x1a_Long.setpaintingStrategy(paintingStrategy.dashes); x1a_Long.setlineWeight(1); x1a_Long.setdefaultColor(color.magenta); x1a_Long.hideBubble(); def X1aL =(if isNaN(x1a_Long[1]) then x1a_Long else Double.NaN); addchartBubble(Target_Bubbles and x1a_Long, x1aL,"1/2xL : " + AsDollars((x1a_Long - L_Entry) * Point),color.magenta); #OneX Long plot x1_Long = if Targetlines and x1a_Long > line4 then (L_Entry +(L_Entry - L_Stoploss)) else double.nan; x1_Long.setpaintingStrategy(paintingStrategy.dashes); x1_Long.setlineWeight(1); x1_Long.setdefaultColor(color.yellow); def X1L =(if isNaN(x1_Long[1]) then x1_Long else Double.NaN); addchartBubble(Target_Bubbles and x1_Long, x1L,"1xL : " + AsDollars((x1_Long - L_Entry) * Point),color.yellow); #TwoX Long plot x2_Long = if Targetlines then x1_Long +(L_Entry - L_Stoploss) else double.nan; x2_Long.setpaintingStrategy(paintingStrategy.line); x2_Long.setlineWeight(2); x2_Long.setdefaultColor(color.light_red); def X2L =(if isNaN(x2_Long[1]) then x2_Long else Double.NaN); addchartBubble(Target_Bubbles and x2_Long, x2L,"2xL : " + AsDollars((x2_Long - L_Entry) * Point),color.light_red); #ThreeX Long plot x3_Long = if Targetlines then x2_Long +(L_Entry - L_Stoploss) else double.nan; x3_Long.setpaintingStrategy(paintingStrategy.dashes); x3_Long.setlineWeight(1); x3_Long.setdefaultColor(color.cyan); def X3L =(if isNaN(x3_Long[1]) then x3_Long else Double.NaN); addchartBubble(Target_Bubbles and x3_Long, x3L,"3xL : " + AsDollars((x3_Long - L_Entry) * Point) ,color.cyan); #FourX Long plot x4_Long = if Targetlines then x3_Long +(L_Entry - L_Stoploss) else double.nan; x4_Long.setpaintingStrategy(paintingStrategy.dashes); x4_Long.setlineWeight(1); x4_Long.setdefaultColor(color.white); def X4L =(if isNaN(x4_Long[1]) then x4_Long else Double.NaN); addchartBubble(Target_Bubbles and x4_Long, x4L,"4xL : " + AsDollars((x4_Long - L_Entry) * Point),color.white); #HalfX Short plot x1a_Short = if Targetlines then (S_Entry -(S_Stoploss - S_Entry)/2) else double.nan; x1a_Short.setpaintingStrategy(paintingStrategy.dashes); x1a_Short.setlineWeight(1); x1a_Short.setdefaultColor(color.magenta); x1a_Short.hideBubble(); def X1AS =(if isNaN(x1a_Short[1]) then x1a_Short else Double.NaN); addchartBubble(Target_Bubbles and x1a_Short, x1aS,"1/2xS : " + AsDollars((S_Entry - x1a_Short) * Point),color.magenta,0); #OneX Short plot x1_Short = if Targetlines and x1a_short < line3 then (S_Entry -(S_Stoploss - S_Entry)) else double.nan; x1_Short.setpaintingStrategy(paintingStrategy.dashes); x1_Short.setlineWeight(1); x1_Short.setdefaultColor(color.yellow); def X1S =(if isNaN(x1_Short[1]) then x1_Short else Double.NaN); addchartBubble(Target_Bubbles and x1_Short, x1S,"2xS : " + AsDollars((S_Entry - x1_Short) * Point),color.yellow,0); #TwoX Short plot x2_Short = if Targetlines then x1_Short -(S_Stoploss - S_Entry) else double.nan; x2_Short.setpaintingStrategy(paintingStrategy.line); x2_Short.setlineWeight(2); x2_Short.setdefaultColor(color.light_green); def X2S =(if isNaN(x2_Short[1]) then x2_Short else Double.NaN); addchartBubble(Target_Bubbles and x2_Short, x2S,"2xS : " + AsDollars((S_Entry - x2_Short) * Point),color.light_green,0); #ThreeX Short plot x3_Short = if Targetlines then x2_Short -(S_Stoploss - S_Entry) else double.nan; x3_Short.setpaintingStrategy(paintingStrategy.dashes); x3_Short.setlineWeight(1); x3_Short.setdefaultColor(color.cyan); def X3S =(if isNaN(x3_Short[1]) then x3_Short else Double.NaN); addchartBubble(Target_Bubbles and x3_Short, x3S,"3xS : " + AsDollars((S_Entry - x3_Short) * Point),color.cyan,0); #FourX Short plot x4_Short = if Targetlines then x3_Short -(S_Stoploss - S_Entry) else double.nan; x4_Short.setpaintingStrategy(paintingStrategy.dashes); x4_Short.setlineWeight(1); x4_Short.setdefaultColor(color.white); def X4S =(if isNaN(x4_Short[1]) then x4_Short else Double.NaN); addchartBubble(Target_Bubbles and x4_Short, x4S,"4xS : " + AsDollars((S_Entry - x4_Short) * Point),color.white,0); #LinearRegCh100 RegressionDivergence - Trigger Lines - Trend Cross # From Lizard Indicators Link: https://www.lizardindicators.com/trigger-lines-cross-vs-thrust/ # Line #1 - Fast = LinReg (80) # Line #2 - Slow = EXPEMA[LinReg (80)] input LinRegLength = 80; input EMAlength = 20; #input ColorOn = yes; #Definitions def price1 = close; def displace = 0; def LinReg = Inertia(price1[-displace], LinRegLength); def EMA_LR = ExpAverage(LinReg[-displace], EMAlength); def Body = (open + close)/2; # Defining Long/Short Filters (these instructions determine entries / exits) # Entry Requirements def Long_Entry = close > LinReg and close > EMA_LR and body > LinReg and body > EMA_LR and close > high[1] and body > body[1]; # LinReg > LinReg[1] and def Long_Stay_In = close > LinReg and close > EMA_LR; def Long_Exit = (close < LinReg or close < EMA_LR) or Long_Stay_In == 0; def Long_State = If Long_Entry then 1 else if Long_Exit then 0 else Long_State[1]; def Long1 = Long_State; # Exit Requirements def Short_Entry = close < LinReg and close < EMA_LR and body < LinReg and body < EMA_LR and close < low[1] and body < body[1]; # LinReg < LinReg[1] and def Short_Stay_In = close < LinReg and close < EMA_LR; def Short_Exit = (close > LinReg or close > EMA_LR) or Short_Stay_In == 0; def Short_State = If Short_Entry then 1 else if Short_Exit then 0 else Short_State[1]; def Short1 = Short_State; #Adding Linear Regression averages plot LR = LinReg; LR.SetDefaultColor(CreateColor(0, 130, 255)); plot EMA_LinReg = EMA_LR; EMA_LinReg.SetDefaultColor(CreateColor(255, 215,0)); LR.setlineweight(1); EMA_LinReg.setlineweight(1); #DYNO Label AddLabel(yes and labels and Short1, "DYNO:BEARISH", color.RED); AddLabel(yes and labels and Long1, "DYNO:BULLISH", color.green); AddLabel(yes and labels and Long1 == Short1, "DYNO:NEUTRAL", color.YELLOW); #Regression Bands input deviations1 = 1.38; #set your deviation units here. input deviations = 2; #set your deviation units here. input length = 500; #set your channel lookback period here. def stdDeviation = StDevAll(price, length); plot HighBand = if Bands then EMA_LinReg + deviations * stdDeviation else double.nan; HighBand.SetDefaultColor(Color.red); plot LowBand = if Bands then EMA_LinReg - deviations * stdDeviation else double.nan; LowBand.SetDefaultColor(Color.green); plot HighBand1 = if Bands then EMA_LinReg + deviations1 * stdDeviation else double.nan; HighBand1.SetDefaultColor(Color.light_red); plot LowBand1 = if Bands then EMA_LinReg - deviations1 * stdDeviation else double.nan; LowBand1.SetDefaultColor(Color.light_green); DefineGlobalColor("Bullish", Color.light_green); DefineGlobalColor("Bearish", Color.light_RED); AddCloud(Highband, Highband1, GlobalColor("Bearish"), GlobalColor("Bullish")); AddCloud(lowband1, lowband, GlobalColor("Bullish"), GlobalColor("Bearish")); #200 DAY MOVING AVERAGE input lengthAvgEXP = 200; input Num_Dev_Dn1 = -1.3; input Num_Dev_up1 = 1.3; input Num_Dev_Dn = -2.0; input Num_Dev_up = 2.0; input BB = yes; def pricebb = close; def averageType = AverageType.exponential; def sDev = stdev(data = pricebb[-displace], length = lengthAvgEXP); plot AvgExp = MovingAverage(averageType, data = pricebb[-displace], length = lengthAvgEXP); plot LowerBand = if BB then AvgExp + num_Dev_Dn * sDev else double.nan; plot UpperBand = if BB then AvgExp + num_Dev_Up * sDev else double.nan; AvgExp.SetDefaultColor(Color.white); AvgExp.setlineweight(2); LowerBand.SetDefaultColor(Color.white); UpperBand.SetDefaultColor(Color.white); # Coloring Bars #AssignPriceColor(if ColorON and Long_State then Color.GREEN else if ColorON and Short_State then Color.RED else Color.Yellow); DefineGlobalColor("Bullish", Color.dark_Green); DefineGlobalColor("Bearish", Color.dark_Red); AddCloud(EMA_LR, LinReg, GlobalColor("Bearish"), GlobalColor("Bullish")); #Label #AddLabel(yes, Long_Entry +": $" + Long_Entry+ ": $" +PriceNETChange + ": " + AsPercent(PctChange), if PctChange >= 0 then Color.Green else if PctChange < 0 then Color.Red else Color.Gray); ################### # # ALERTS # ################### Alert(alertON and LongTrigger, "Long Entry", Alert.BAR, Sound.Ding); Alert(alertON and ShortTrigger, "Short Entry", Alert.BAR, Sound.Ding); Alert(alertON and Buysetup, "HULL Buy", Alert.BAR, Sound.Bell); Alert(alertON and Sellsetup, "HULL Sell", Alert.BAR, Sound.Bell); Alert(alertON and high > highband, "Short Band", Alert.BAR, Sound.Ding); Alert(alertON and low < lowband, "Long Band", Alert.BAR, Sound.Ding);
VERSION 2: This version does NOT repaint. http://tos.mx/0pAVf4i
Thanks, and enjoy!!
The supertrend is either the cyan or magenta lines. This is what you're looking for price to break.Chewie, great work. Thank You so much for sharing with us. I am not clear about #3 Setup, "Break of SuperTrend Indicator. Do you mind further explaining this? I tried going into the code to figure it out but since I am not a coder I couldnt do it. Last computer class was either Cobol or Fortran with punch cards.
Praise GOD!!! I believe I finally have it. Has taken me three days but I now know the trigger. Bullish move = Magenta (Pink) Line ........Bearish move = Cyan (Blue) Line. Please tell me this is correct.The supertrend is either the cyan or magenta lines. This is what you're looking for price to break.
That's it.Praise GOD!!! I believe I finally have it. Has taken me three days but I now know the trigger. Bullish move = Magenta (Pink) Line ........Bearish move = Cyan (Blue) Line. Please tell me this is correct.
Do u have the link for the profit targets on your charts? Thank youI assembled this indicator that includes a few combined indicators based on watching this video.I changed a few of the settings however. This is a trading system or strategy that includes where to enter a trade, where to place your stop loss, and 5 targets, and when to close your trade. There is a real "strategy" below that can be loaded as well to view actual profit/loss. Many thanks to the other contributors who created these indicators. NOTE: I know some people love a clean chart and will say that this is too messy. I understand that. You can uncheck viewing any of the plots within the indicator, like certain target lines you don't want to see or anything else if you prefer.
I added "Quantity" as an input for you to see how much money you are risking and how much money you will get at each target level.
"Quantity" is the number of futures contracts or number of shares of stock you are trading.
Ok, let's carry on. Below is first the trading system summary, and a bunch of chart examples.
SUMMARY OF TRADING SYSTEM:
1.The best trades are in the direction of the 200 EMA (white line). Important point that is why it is #1. Always check first where is the white line 200 EMA.
2. SETUP: You must see three things to define an entry position.
1. A top or bottom reversal signal of the Hull Moving Avg plotted with a white square (top) or white triangle (bottom).
2. Lower Donchian Trend Ribbon either green or red in the color of the direction you are entering the trade. (Shout out to @halcyonguy who converted this into TOS. Much appreciated, you are awesome!!!)
3. Break of the Super Trend indicator. (Default setting is 2.75. Feel free to adjust this if you want in the settings)
4. Stop Loss is placed at or just below the reversal Hull Moving Avg square or triangle. (In some instances, the 200 EMA could be your stop loss.)
3. The first thing that you should expect to see when all 3 triggers are set is when price breaks through the Super Trend, there is sometimes resistance at the first magenta dashed line. This is half of the 1st target. That could be your first trade with trade orders set in place prior to seeing the 3 triggers take effect. Sometimes it is safer to watch price break through the Super Trend, retrace back below, and enter at the entry line as it breaks through the second time.
4. Once price hits the dashed magenta line, it typically either continues in a strong move, or it will come back to the entry line or below. A secondary move will typically push past the magenta line to the next 1x yellow dashed target.
5.Once price hits the first 1x target, it will typically either continue to the 2x target, or retrace back to the 1x or Entry line. 2x target is the goal, but sometimes price will blast to 3x or 4x target.
6.There are times when price will extend beyond the 4x target.
7.The Hull reversal point (white square or triangle) will have a line drawn which is the stop loss. This level is sometimes used as support or resistance, so take note of this area and how price reacts to it.
8.Included is a DYNO regression average that will color the candles green when price is above, red when price is below and yellow when price is between the two lines. Regression bands are also displayed and can be turned on/off in the settings. Your trade should correspond to the color of the candles. Long trade = green candles, short trade = red candles.
9.TRADE EXIT: Place your exit order at any of the target levels of your choice. If price goes beyond the first magenta line, consider moving your stop loss to the entry line (break even), or to the magenta line. You could also move your stop loss to either trail with the Super Trend, or with the Hull moving average. Typically breaking the Hull moving average closes the trade.
This indicator includes labels for the Super Trend, Hull avg, and Dyno regression average. These labels can be turned on/off in the settings.
This indicator includes bubbles for target levels and bubbles for trade entry and stop loss. Bubbles are off by default. These bubbles can be turned on/off in the settings.
This indicator includes various alerts for when Super Trend breaks, when the Hull avg creates a reversal buy/sell signal, and when price crosses the regression bands. These alerts can be turned on/off in the settings.
All example charts are on the 4 minute timeframe. I like the 4 min. Different timeframes will obviously give you different results. Let's get to it!
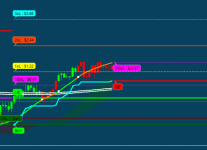
View attachment 14262
In the above chart, you have all 3 conditions trigger in the same red candle. 1. Hull reversal point, 2. Red color Donchian Trend Ribbon, 3. Break below of the cyan Super Trend. Take note on how price first hits the magenta dashed line and retraces beyond the Entry Line. It hits the 1X target and continues all the way to 4X target. If you didn't take the 4x target, price breaking the Hull moving average indicates time to close the trade.
View attachment 14263
In the above chart, there are two trades long and short. Look for all 3 conditions to trigger. 1. Hull reversal point, 2. color Donchian Trend Ribbon, 3. Break of the Super Trend. In the first trade, price goes above the 200 EMA and hits the 2x target. Closing below the Hull average would close the trade. In the second trade, price hits 3x target, and breaking the Hull avg would close the trade.
View attachment 14264
In the above chart, there is a slight downward slope of the 200 EMA, the top Hull reversal plots, Donchian Trend Ribbon is red, you are looking to short at the break of the Super Trend. It rapidly goes to the 4x target and breaks the Hull avg closing the trade.
View attachment 14265
In the above chart, all 3 trade setups take place to enter the trade. Price retraces back to the 200 EMA which is above your stop loss. It then continues higher to 4x target. Either have an exit order at the 4x level, or trail stop loss with Super Trend or the yellow Dyno average.
View attachment 14266
In the above chart, all 3 trade setups take place to enter the trade. Price retraces back to the 200 EMA which is above your stop loss. It then continues higher to beyond the 4x target. You must take your profits. Don’t be greedy.
View attachment 14267
In the above chart, all 3 trade setups take place to enter the trade. Price is below the 200 EMA and you short. Here is a tricky situation. It barely breaks the Super Trend. It hits your stop loss, but never closes above your stop loss. It then goes to tag the 3x target. Better to be safe and have your stop loss hit, or have a wider stop loss at the 200 EMA.
View attachment 14268
In the above chart, all 3 trade setups take place to enter the trade. Price is below the 200 EMA and you think it could tag it. Price stays above the Hull avg and hits both the 4x target and the 200 EMA. Be cautious because typically you want to trade in the direction of the 200, but when price is far from it, there is a chance it will come back to it.
View attachment 14269
In the above chart, all 3 trade setups take place to enter the trade. Price previously is rejected at the 200 EMA and it is rejected a second time. You take the short setup. Price stays below the Hull avg and hits the 3x target. If you didn’t get out at the 3x, you would exit the trade at the break of the Hull avg. Nice trade!
View attachment 14270
In the above chart, all 3 trade setups take place to enter the trade. Price breaks above the 200 EMA at your entry. 2x target is hit and price breaks the Hull avg. Good time to take profits, or trail your stop at the Super Trend and take profit at the 4x target.
View attachment 14271
I created a strategy, however, it does not incorporate the lower Donchian Trend Ribbon. It also exits trades if it hits levels and breaks back, so it’s pretty conservative. On the 4 min chart, ES would have a profit of $33,234 in the last 30 days.
And now for the codes.
SHAREABLE LINKS:
Upper Indicator Code: http://tos.mx/sxtzndQ
Donchian Trend Ribbon Indicator Code: http://tos.mx/MMxMs6u This can also be found at this post. https://usethinkscript.com/threads/donchian-trend-ribbon-for-thinkorswim.10861/#post-95366
Note: the Donchian Trend Ribbon has a lower histogram. When the lower histogram is magenta color, it is sign of major selling. When cyan, it is major buying, when it is dark green or dark red, it is in consolidation.
Strategy Code: NOTE: Strategy does not take into account the Hull Avg or the Donchian Ribbon, only the Super Trend break and the target levels. http://tos.mx/neHVQml
Code:#Hull_SuperTrend_Trading_System # assembled by Chewie 4/10/2022 # many thanks to all the other noted contributors to this system. # SuperTrend Yahoo Finance Replica - Modified from Modius SuperTrend # Modified Modius ver. by RConner7 # Modified by Barbaros to replicate look from TradingView version # Modified by Barbaros to add EMA cross for bubbles and alerts # Modified by Barbaros to update bar color painting # v3.3 input Quantity = 1; input Target_Bubbles = no; input Entry_SL_Bubbles = no; input Targetlines = yes; input Labels = yes; input alertON = yes; input Bands = yes; input AvgType = AverageType.HULL; input STAtrMult = 2.75; input nATR = 12; def Point = (Quantity / ticksize()) * tickvalue(); def ATR = ATR("length" = nATR, "average type" = AvgType); def UP_Band_Basic = HL2 + (STAtrMult * ATR); def LW_Band_Basic = HL2 + (-STAtrMult * ATR); def UP_Band = if ((UP_Band_Basic < UP_Band[1]) or (close[1] > UP_Band[1])) then UP_Band_Basic else UP_Band[1]; def LW_Band = if ((LW_Band_Basic > LW_Band[1]) or (close[1] < LW_Band[1])) then LW_Band_Basic else LW_Band[1]; def ST = if ((ST[1] == UP_Band[1]) and (close < UP_Band)) then UP_Band else if ((ST[1] == UP_Band[1]) and (close > Up_Band)) then LW_Band else if ((ST[1] == LW_Band[1]) and (close > LW_Band)) then LW_Band else if ((ST[1] == LW_Band) and (close < LW_Band)) then UP_Band else LW_Band; plot Long = if close > ST then ST else Double.NaN; Long.AssignValueColor(Color.cyan); Long.SetLineWeight(3); plot Short = if close < ST then ST else Double.NaN; Short.AssignValueColor(Color.magenta); Short.SetLineWeight(3); def LongTrigger = isNaN(Long[1]) and !isNaN(Long); def ShortTrigger = isNaN(Short[1]) and !isNaN(Short); plot LongDot = if LongTrigger then ST else Double.NaN; LongDot.SetPaintingStrategy(PaintingStrategy.POINTS); LongDot.AssignValueColor(Color.cyan); LongDot.SetLineWeight(4); plot ShortDot = if ShortTrigger then ST else Double.NaN; ShortDot.SetPaintingStrategy(PaintingStrategy.POINTS); ShortDot.AssignValueColor(Color.magenta); ShortDot.SetLineWeight(4); AddChartBubble(Entry_SL_Bubbles and LongTrigger, ST, "BUY", Color.GREEN, no); AddChartBubble(Entry_SL_Bubbles and ShortTrigger, ST, "SELL", Color.RED, yes); #Super Trend Labels AddLabel(yes and labels and Long, "ST:LONG", color.CYAN); AddLabel(yes and labels and Short, "ST:SHORT", color.magenta); # # Hull Moving Average Concavity and Turning Points # # Author: Seth Urion (Mahsume) # Version: 2020-05-01 V4 # # Now with support for ToS Mobile # declare upper; input HMA_Length = 60; input lookback = 3; input arrows = no; def price = HL2; plot HMA = HullMovingAvg(price = price, length = HMA_Length); def delta = HMA[1] - HMA[lookback + 1]; def delta_per_bar = delta / lookback; def next_bar = HMA[1] + delta_per_bar; def concavity = if HMA > next_bar then 1 else -1; plot turning_point = if concavity[1] != concavity then HMA else double.nan; HMA.AssignValueColor(color = if concavity[1] == -1 then if HMA > HMA[1] then color.dark_orange else color.red else if HMA < HMA[1] then color.dark_green else color.green); HMA.SetLineWeight(3); input ColorON = yes; def Long_StateH = close > HMA; def Short_StateH = close < HMA; # Coloring Bars AssignPriceColor(if ColorON and Long_StateH then Color.GREEN else if ColorON and Short_StateH then Color.RED else Color.current); turning_point.SetLineWeight(2); turning_point.SetPaintingStrategy(paintingStrategy = PaintingStrategy.POINTS); turning_point.SetDefaultColor(color.white); plot MA_Max = if HMA[-1] < HMA and HMA > HMA[1] then HMA else Double.NaN; MA_Max.SetDefaultColor(Color.WHITE); MA_Max.SetPaintingStrategy(PaintingStrategy.SQUARES); MA_Max.SetLineWeight(5); plot MA_Min = if HMA[-1] > HMA and HMA < HMA[1] then HMA else Double.Nan; MA_Min.SetDefaultColor(Color.WHITE); MA_Min.SetPaintingStrategy(PaintingStrategy.TRIANGLES); MA_Min.SetLineWeight(5); def BuySetup = HMA > HMA[1] and HMA[1] < HMA[2]; def SellSetup = HMA < HMA[1] and HMA[1] > HMA[2]; plot sell = if arrows and turning_point and concavity == -1 then high else double.nan; sell.SetDefaultColor(Color.DARK_ORANGE); sell.SetPaintingStrategy(PaintingStrategy.ARROW_DOWN); sell.SetLineWeight(3); plot buy = if arrows and turning_point and concavity == 1 then low else double.nan; buy.SetDefaultColor(Color.CYAN); buy.SetPaintingStrategy(PaintingStrategy.ARROW_UP); buy.SetLineWeight(3); def divergence = HMA - next_bar; ################### # # 2020-05-01 # # MOBILE TOS SUPPORT # # Each color of the HMA needs to be a separate plot as ToS Mobile # lacks the ability to assign colors the way ToS Desktop does. # I recommend a plain colored HMA behind the line # Set the line color of the HMA above to gray or some neutral # # CCD_D -> ConCave Down and Decreasing # CCD_I -> ConCave Down and Increasing # CCU_D -> ConCave Up and Decreasing # CCU_I -> ConCave Up and Increasing # ################### plot CCD_D = if concavity == -1 and HMA < HMA[1] then HMA else double.nan; CCD_D.SetDefaultColor(Color.RED); CCD_D.SetLineWeight(1); plot CCD_I = if concavity == -1 and HMA >= HMA[1] then HMA else double.nan; CCD_I.SetDefaultColor(Color.DARK_ORANGE); CCD_I.SetLineWeight(1); plot CCU_D = if concavity == 1 and HMA <= HMA[1] then HMA else double.nan; CCU_D.SetDefaultColor(COLOR.DARK_GREEN); CCU_D.SetLineWeight(1); plot CCU_I = if concavity == 1 and HMA > HMA[1] then HMA else double.nan; CCU_I.SetDefaultColor(COLOR.GREEN); CCU_I.SetLineWeight(1); #Hull Label AddLabel(yes and labels and CCD_D, "HULL:SELL", color.RED); AddLabel(yes and labels and CCU_I, "HULL:BUY", color.green); AddLabel(yes and labels and CCU_D, "HULL:WEAK SELL", color.dark_green); AddLabel(yes and labels and CCD_I, "HULL:WEAK BUY", color.DARK_ORANGE); #Target lines # created by chewie #Long Entry rec line4 = if IsNaN(short) then line4[1] else short[0]; plot L_Entry = if IsNaN(short) then line4 else double.nan; L_Entry.setpaintingStrategy(paintingStrategy.LINE); L_Entry.setlineWeight(3); L_Entry.setdefaultColor(color.green); L_Entry.hideBubble(); def LE =(if isNaN(L_Entry[1]) then L_Entry else Double.NaN); addchartBubble(Entry_SL_Bubbles and L_Entry, LE,"L/E",color.GREEN); #Long Stoploss rec line = if IsNaN(MA_Min) then line[1] else MA_Min[0]; plot L_stoploss= if isnan(MA_Min) then line else double.nan; L_stoploss.setpaintingStrategy(paintingStrategy.LINE); L_stoploss.setlineWeight(3); L_stoploss.setdefaultColor(color.dark_green); L_stoploss.hideBubble(); def LSL =(if isNaN(L_stoploss[1]) then L_stoploss else Double.NaN); addchartBubble(Entry_SL_Bubbles and L_stoploss, LSL,"L/SL : -" + AsDollars((L_Entry - L_stoploss) * Point),color.DARK_GREEN); #Short Entry rec line3 = if IsNaN(long) then line3[1] else long[0]; plot S_Entry = if IsNaN(long) then line3 else double.nan; S_Entry.setpaintingStrategy(paintingStrategy.LINE); S_Entry.setlineWeight(3); S_Entry.setdefaultColor(color.red); S_Entry.hideBubble(); def SE =(if isNaN(S_Entry[1]) then S_Entry else Double.NaN); addchartBubble(Entry_SL_Bubbles and S_Entry, SE,"S/E",color.RED,0); #Short Stoploss rec line2 = if IsNaN(MA_Max) then line2[1] else MA_Max[0]; plot S_stoploss = if IsNaN(MA_MAX) then line2 else double.nan; S_stoploss.setpaintingStrategy(paintingStrategy.LINE); S_stoploss.setlineWeight(3); S_stoploss.setdefaultColor(color.dark_red); S_stoploss.hideBubble(); def SSL =(if isNaN(S_stoploss[1]) then S_stoploss else Double.NaN); addchartBubble(Entry_SL_Bubbles and S_stoploss, SSL,"S/SL :-" + AsDollars((S_Stoploss - S_Entry) * Point),color.DARK_RED); #HalfX Long plot x1a_Long = if Targetlines then (L_Entry +(L_Entry - L_Stoploss)/2) else double.nan; x1a_Long.setpaintingStrategy(paintingStrategy.dashes); x1a_Long.setlineWeight(1); x1a_Long.setdefaultColor(color.magenta); x1a_Long.hideBubble(); def X1aL =(if isNaN(x1a_Long[1]) then x1a_Long else Double.NaN); addchartBubble(Target_Bubbles and x1a_Long, x1aL,"1/2xL : " + AsDollars((x1a_Long - L_Entry) * Point),color.magenta); #OneX Long plot x1_Long = if Targetlines and x1a_Long > line4 then (L_Entry +(L_Entry - L_Stoploss)) else double.nan; x1_Long.setpaintingStrategy(paintingStrategy.dashes); x1_Long.setlineWeight(1); x1_Long.setdefaultColor(color.yellow); def X1L =(if isNaN(x1_Long[1]) then x1_Long else Double.NaN); addchartBubble(Target_Bubbles and x1_Long, x1L,"1xL : " + AsDollars((x1_Long - L_Entry) * Point),color.yellow); #TwoX Long plot x2_Long = if Targetlines then x1_Long +(L_Entry - L_Stoploss) else double.nan; x2_Long.setpaintingStrategy(paintingStrategy.line); x2_Long.setlineWeight(2); x2_Long.setdefaultColor(color.light_red); def X2L =(if isNaN(x2_Long[1]) then x2_Long else Double.NaN); addchartBubble(Target_Bubbles and x2_Long, x2L,"2xL : " + AsDollars((x2_Long - L_Entry) * Point),color.light_red); #ThreeX Long plot x3_Long = if Targetlines then x2_Long +(L_Entry - L_Stoploss) else double.nan; x3_Long.setpaintingStrategy(paintingStrategy.dashes); x3_Long.setlineWeight(1); x3_Long.setdefaultColor(color.cyan); def X3L =(if isNaN(x3_Long[1]) then x3_Long else Double.NaN); addchartBubble(Target_Bubbles and x3_Long, x3L,"3xL : " + AsDollars((x3_Long - L_Entry) * Point) ,color.cyan); #FourX Long plot x4_Long = if Targetlines then x3_Long +(L_Entry - L_Stoploss) else double.nan; x4_Long.setpaintingStrategy(paintingStrategy.dashes); x4_Long.setlineWeight(1); x4_Long.setdefaultColor(color.white); def X4L =(if isNaN(x4_Long[1]) then x4_Long else Double.NaN); addchartBubble(Target_Bubbles and x4_Long, x4L,"4xL : " + AsDollars((x4_Long - L_Entry) * Point),color.white); #HalfX Short plot x1a_Short = if Targetlines then (S_Entry -(S_Stoploss - S_Entry)/2) else double.nan; x1a_Short.setpaintingStrategy(paintingStrategy.dashes); x1a_Short.setlineWeight(1); x1a_Short.setdefaultColor(color.magenta); x1a_Short.hideBubble(); def X1AS =(if isNaN(x1a_Short[1]) then x1a_Short else Double.NaN); addchartBubble(Target_Bubbles and x1a_Short, x1aS,"1/2xS : " + AsDollars((S_Entry - x1a_Short) * Point),color.magenta,0); #OneX Short plot x1_Short = if Targetlines and x1a_short < line3 then (S_Entry -(S_Stoploss - S_Entry)) else double.nan; x1_Short.setpaintingStrategy(paintingStrategy.dashes); x1_Short.setlineWeight(1); x1_Short.setdefaultColor(color.yellow); def X1S =(if isNaN(x1_Short[1]) then x1_Short else Double.NaN); addchartBubble(Target_Bubbles and x1_Short, x1S,"2xS : " + AsDollars((S_Entry - x1_Short) * Point),color.yellow,0); #TwoX Short plot x2_Short = if Targetlines then x1_Short -(S_Stoploss - S_Entry) else double.nan; x2_Short.setpaintingStrategy(paintingStrategy.line); x2_Short.setlineWeight(2); x2_Short.setdefaultColor(color.light_green); def X2S =(if isNaN(x2_Short[1]) then x2_Short else Double.NaN); addchartBubble(Target_Bubbles and x2_Short, x2S,"2xS : " + AsDollars((S_Entry - x2_Short) * Point),color.light_green,0); #ThreeX Short plot x3_Short = if Targetlines then x2_Short -(S_Stoploss - S_Entry) else double.nan; x3_Short.setpaintingStrategy(paintingStrategy.dashes); x3_Short.setlineWeight(1); x3_Short.setdefaultColor(color.cyan); def X3S =(if isNaN(x3_Short[1]) then x3_Short else Double.NaN); addchartBubble(Target_Bubbles and x3_Short, x3S,"3xS : " + AsDollars((S_Entry - x3_Short) * Point),color.cyan,0); #FourX Short plot x4_Short = if Targetlines then x3_Short -(S_Stoploss - S_Entry) else double.nan; x4_Short.setpaintingStrategy(paintingStrategy.dashes); x4_Short.setlineWeight(1); x4_Short.setdefaultColor(color.white); def X4S =(if isNaN(x4_Short[1]) then x4_Short else Double.NaN); addchartBubble(Target_Bubbles and x4_Short, x4S,"4xS : " + AsDollars((S_Entry - x4_Short) * Point),color.white,0); #LinearRegCh100 RegressionDivergence - Trigger Lines - Trend Cross # From Lizard Indicators Link: https://www.lizardindicators.com/trigger-lines-cross-vs-thrust/ # Line #1 - Fast = LinReg (80) # Line #2 - Slow = EXPEMA[LinReg (80)] input LinRegLength = 80; input EMAlength = 20; #input ColorOn = yes; #Definitions def price1 = close; def displace = 0; def LinReg = Inertia(price1[-displace], LinRegLength); def EMA_LR = ExpAverage(LinReg[-displace], EMAlength); def Body = (open + close)/2; # Defining Long/Short Filters (these instructions determine entries / exits) # Entry Requirements def Long_Entry = close > LinReg and close > EMA_LR and body > LinReg and body > EMA_LR and close > high[1] and body > body[1]; # LinReg > LinReg[1] and def Long_Stay_In = close > LinReg and close > EMA_LR; def Long_Exit = (close < LinReg or close < EMA_LR) or Long_Stay_In == 0; def Long_State = If Long_Entry then 1 else if Long_Exit then 0 else Long_State[1]; def Long1 = Long_State; # Exit Requirements def Short_Entry = close < LinReg and close < EMA_LR and body < LinReg and body < EMA_LR and close < low[1] and body < body[1]; # LinReg < LinReg[1] and def Short_Stay_In = close < LinReg and close < EMA_LR; def Short_Exit = (close > LinReg or close > EMA_LR) or Short_Stay_In == 0; def Short_State = If Short_Entry then 1 else if Short_Exit then 0 else Short_State[1]; def Short1 = Short_State; #Adding Linear Regression averages plot LR = LinReg; LR.SetDefaultColor(CreateColor(0, 130, 255)); plot EMA_LinReg = EMA_LR; EMA_LinReg.SetDefaultColor(CreateColor(255, 215,0)); LR.setlineweight(1); EMA_LinReg.setlineweight(1); #DYNO Label AddLabel(yes and labels and Short1, "DYNO:BEARISH", color.RED); AddLabel(yes and labels and Long1, "DYNO:BULLISH", color.green); AddLabel(yes and labels and Long1 == Short1, "DYNO:NEUTRAL", color.YELLOW); #Regression Bands input deviations1 = 1.38; #set your deviation units here. input deviations = 2; #set your deviation units here. input length = 500; #set your channel lookback period here. def stdDeviation = StDevAll(price, length); plot HighBand = if Bands then EMA_LinReg + deviations * stdDeviation else double.nan; HighBand.SetDefaultColor(Color.red); plot LowBand = if Bands then EMA_LinReg - deviations * stdDeviation else double.nan; LowBand.SetDefaultColor(Color.green); plot HighBand1 = if Bands then EMA_LinReg + deviations1 * stdDeviation else double.nan; HighBand1.SetDefaultColor(Color.light_red); plot LowBand1 = if Bands then EMA_LinReg - deviations1 * stdDeviation else double.nan; LowBand1.SetDefaultColor(Color.light_green); DefineGlobalColor("Bullish", Color.light_green); DefineGlobalColor("Bearish", Color.light_RED); AddCloud(Highband, Highband1, GlobalColor("Bearish"), GlobalColor("Bullish")); AddCloud(lowband1, lowband, GlobalColor("Bullish"), GlobalColor("Bearish")); #200 DAY MOVING AVERAGE input lengthAvgEXP = 200; input Num_Dev_Dn1 = -1.3; input Num_Dev_up1 = 1.3; input Num_Dev_Dn = -2.0; input Num_Dev_up = 2.0; input BB = yes; def pricebb = close; def averageType = AverageType.exponential; def sDev = stdev(data = pricebb[-displace], length = lengthAvgEXP); plot AvgExp = MovingAverage(averageType, data = pricebb[-displace], length = lengthAvgEXP); plot LowerBand = if BB then AvgExp + num_Dev_Dn * sDev else double.nan; plot UpperBand = if BB then AvgExp + num_Dev_Up * sDev else double.nan; AvgExp.SetDefaultColor(Color.white); AvgExp.setlineweight(2); LowerBand.SetDefaultColor(Color.white); UpperBand.SetDefaultColor(Color.white); # Coloring Bars #AssignPriceColor(if ColorON and Long_State then Color.GREEN else if ColorON and Short_State then Color.RED else Color.Yellow); DefineGlobalColor("Bullish", Color.dark_Green); DefineGlobalColor("Bearish", Color.dark_Red); AddCloud(EMA_LR, LinReg, GlobalColor("Bearish"), GlobalColor("Bullish")); #Label #AddLabel(yes, Long_Entry +": $" + Long_Entry+ ": $" +PriceNETChange + ": " + AsPercent(PctChange), if PctChange >= 0 then Color.Green else if PctChange < 0 then Color.Red else Color.Gray); ################### # # ALERTS # ################### Alert(alertON and LongTrigger, "Long Entry", Alert.BAR, Sound.Ding); Alert(alertON and ShortTrigger, "Short Entry", Alert.BAR, Sound.Ding); Alert(alertON and Buysetup, "HULL Buy", Alert.BAR, Sound.Bell); Alert(alertON and Sellsetup, "HULL Sell", Alert.BAR, Sound.Bell); Alert(alertON and high > highband, "Short Band", Alert.BAR, Sound.Ding); Alert(alertON and low < lowband, "Long Band", Alert.BAR, Sound.Ding);
VERSION 2: This version does NOT repaint. http://tos.mx/0pAVf4i
Thanks, and enjoy!!
Target lines are in the indicator that can be turned on or off.Do u have the link for the profit targets on your charts? Thank you
AddLabel(yes, "    BTO    ", if (close[2] < ST[2] and close[1] > ST[1]) then CreateColor(153,255,153) else Color.White);

AddLabel(yes, " STO ", if (close[2] > ST[2] and close[1] < ST[1]) then CreateColor(255,102,102) else Color.White);AddLabel(yes, " STC ", if (condition2) then CreateColor(153,255,153) else Color.White);
AddLabel(yes, " BTC ", if (condition4) then CreateColor(255,102,102) else Color.White);def condition2 = if high crosses above x4_Long then 1 else if close crosses below x1_Long then 1 else if close crosses below x2_Long then 1 else if close crosses below x3_Long then 1 else if close crosses below HMA then 1 else if close crosses below line[1] then 1 else 0;
def condition4 = if low crosses below x4_Short then 1 else if close crosses above x2_Short then 1 else if close crosses above x3_Short then 1 else if close crosses above HMA then 1 else if close crosses above line2[1] then 1 else 0;#Hull_SuperTrend_Trading_System
# assembled by Chewie 4/10/2022
# many thanks to all the other noted contributors to this system.
# SuperTrend Yahoo Finance Replica - Modified from Modius SuperTrend
# Modified Modius ver. by RConner7
# Modified by Barbaros to replicate look from TradingView version
# Modified by Barbaros to add EMA cross for bubbles and alerts
# Modified by Barbaros to update bar color painting
# v3.3
input Quantity = 1;
input Target_Bubbles = no;
input Entry_SL_Bubbles = no;
input Targetlines = yes;
input Labels = yes;
input alertON = yes;
input Bands = yes;
input AvgType = AverageType.HULL;
input STAtrMult = 2.75;
input nATR = 12;
def Point = (Quantity / ticksize()) * tickvalue();
def ATR = ATR("length" = nATR, "average type" = AvgType);
def UP_Band_Basic = HL2 + (STAtrMult * ATR);
def LW_Band_Basic = HL2 + (-STAtrMult * ATR);
def UP_Band = if ((UP_Band_Basic < UP_Band[1]) or (close[1] > UP_Band[1])) then UP_Band_Basic else UP_Band[1];
def LW_Band = if ((LW_Band_Basic > LW_Band[1]) or (close[1] < LW_Band[1])) then LW_Band_Basic else LW_Band[1];
def ST = if ((ST[1] == UP_Band[1]) and (close < UP_Band)) then UP_Band
else if ((ST[1] == UP_Band[1]) and (close > Up_Band)) then LW_Band
else if ((ST[1] == LW_Band[1]) and (close > LW_Band)) then LW_Band
else if ((ST[1] == LW_Band) and (close < LW_Band)) then UP_Band
else LW_Band;
plot Long = if close > ST then ST else Double.NaN;
Long.AssignValueColor(Color.cyan);
Long.SetLineWeight(3);
plot Short = if close < ST then ST else Double.NaN;
Short.AssignValueColor(Color.magenta);
Short.SetLineWeight(3);
def LongTrigger = isNaN(Long[1]) and !isNaN(Long);
def ShortTrigger = isNaN(Short[1]) and !isNaN(Short);
plot LongDot = if LongTrigger then ST else Double.NaN;
LongDot.SetPaintingStrategy(PaintingStrategy.POINTS);
LongDot.AssignValueColor(Color.cyan);
LongDot.SetLineWeight(4);
plot ShortDot = if ShortTrigger then ST else Double.NaN;
ShortDot.SetPaintingStrategy(PaintingStrategy.POINTS);
ShortDot.AssignValueColor(Color.magenta);
ShortDot.SetLineWeight(4);
AddChartBubble(Entry_SL_Bubbles and LongTrigger, ST, "BUY", Color.GREEN, no);
AddChartBubble(Entry_SL_Bubbles and ShortTrigger, ST, "SELL", Color.RED, yes);
#Super Trend Labels
AddLabel(yes and labels and Long, "ST:LONG", color.CYAN);
AddLabel(yes and labels and Short, "ST:SHORT", color.magenta);
#
# Hull Moving Average Concavity and Turning Points
#
# Author: Seth Urion (Mahsume)
# Version: 2020-05-01 V4
#
# Now with support for ToS Mobile
#
declare upper;
input HMA_Length = 60;
input lookback = 3;
input arrows = no;
def price = HL2;
plot HMA = HullMovingAvg(price = price, length = HMA_Length);
def delta = HMA[1] - HMA[lookback + 1];
def delta_per_bar = delta / lookback;
def next_bar = HMA[1] + delta_per_bar;
def concavity = if HMA > next_bar then 1 else -1;
plot turning_point = if concavity[1] != concavity then HMA else double.nan;
HMA.AssignValueColor(color = if concavity[1] == -1 then
if HMA > HMA[1] then color.dark_orange else color.red else
if HMA < HMA[1] then color.dark_green else color.green);
HMA.SetLineWeight(3);
input ColorON = yes;
def Long_StateH = close > HMA;
def Short_StateH = close < HMA;
# Coloring Bars
AssignPriceColor(if ColorON and Long_StateH then Color.GREEN else if ColorON and Short_StateH then Color.RED else Color.current);
turning_point.SetLineWeight(2);
turning_point.SetPaintingStrategy(paintingStrategy = PaintingStrategy.POINTS);
turning_point.SetDefaultColor(color.white);
plot MA_Max = if HMA[-1] < HMA and HMA > HMA[1] then HMA else Double.NaN;
MA_Max.SetDefaultColor(Color.WHITE);
MA_Max.SetPaintingStrategy(PaintingStrategy.SQUARES);
MA_Max.SetLineWeight(5);
plot MA_Min = if HMA[-1] > HMA and HMA < HMA[1] then HMA else Double.Nan;
MA_Min.SetDefaultColor(Color.WHITE);
MA_Min.SetPaintingStrategy(PaintingStrategy.TRIANGLES);
MA_Min.SetLineWeight(5);
def BuySetup = HMA > HMA[1] and HMA[1] < HMA[2];
def SellSetup = HMA < HMA[1] and HMA[1] > HMA[2];
plot sell = if arrows and turning_point and concavity == -1 then high else double.nan;
sell.SetDefaultColor(Color.DARK_ORANGE);
sell.SetPaintingStrategy(PaintingStrategy.ARROW_DOWN);
sell.SetLineWeight(3);
plot buy = if arrows and turning_point and concavity == 1 then low else double.nan;
buy.SetDefaultColor(Color.CYAN);
buy.SetPaintingStrategy(PaintingStrategy.ARROW_UP);
buy.SetLineWeight(3);
def divergence = HMA - next_bar;
###################
#
# 2020-05-01
#
# MOBILE TOS SUPPORT
#
# Each color of the HMA needs to be a separate plot as ToS Mobile
# lacks the ability to assign colors the way ToS Desktop does.
# I recommend a plain colored HMA behind the line
# Set the line color of the HMA above to gray or some neutral
#
# CCD_D -> ConCave Down and Decreasing
# CCD_I -> ConCave Down and Increasing
# CCU_D -> ConCave Up and Decreasing
# CCU_I -> ConCave Up and Increasing
#
###################
plot CCD_D = if concavity == -1 and HMA < HMA[1] then HMA else double.nan;
CCD_D.SetDefaultColor(Color.RED);
CCD_D.SetLineWeight(1);
plot CCD_I = if concavity == -1 and HMA >= HMA[1] then HMA else double.nan;
CCD_I.SetDefaultColor(Color.DARK_ORANGE);
CCD_I.SetLineWeight(1);
plot CCU_D = if concavity == 1 and HMA <= HMA[1] then HMA else double.nan;
CCU_D.SetDefaultColor(COLOR.DARK_GREEN);
CCU_D.SetLineWeight(1);
plot CCU_I = if concavity == 1 and HMA > HMA[1] then HMA else double.nan;
CCU_I.SetDefaultColor(COLOR.GREEN);
CCU_I.SetLineWeight(1);
#Hull Label
AddLabel(yes and labels and CCD_D, "HULL:SELL", color.RED);
AddLabel(yes and labels and CCU_I, "HULL:BUY", color.green);
AddLabel(yes and labels and CCU_D, "HULL:WEAK SELL", color.dark_green);
AddLabel(yes and labels and CCD_I, "HULL:WEAK BUY", color.DARK_ORANGE);
#Target lines
# created by chewie
#Long Entry
rec line4 = if IsNaN(short) then line4[1] else short[0];
plot L_Entry = if IsNaN(short) then line4 else double.nan;
L_Entry.setpaintingStrategy(paintingStrategy.LINE);
L_Entry.setlineWeight(3);
L_Entry.setdefaultColor(color.green);
L_Entry.hideBubble();
def LE =(if isNaN(L_Entry[1]) then L_Entry else Double.NaN);
addchartBubble(Entry_SL_Bubbles and L_Entry, LE,"L/E",color.GREEN);
#Long Stoploss
rec line = if IsNaN(MA_Min) then line[1] else MA_Min[0];
plot L_stoploss= if isnan(MA_Min) then line else double.nan;
L_stoploss.setpaintingStrategy(paintingStrategy.LINE);
L_stoploss.setlineWeight(3);
L_stoploss.setdefaultColor(color.dark_green);
L_stoploss.hideBubble();
def LSL =(if isNaN(L_stoploss[1]) then L_stoploss else Double.NaN);
addchartBubble(Entry_SL_Bubbles and L_stoploss, LSL,"L/SL : -" + AsDollars((L_Entry - L_stoploss) * Point),color.DARK_GREEN);
#Short Entry
rec line3 = if IsNaN(long) then line3[1] else long[0];
plot S_Entry = if IsNaN(long) then line3 else double.nan;
S_Entry.setpaintingStrategy(paintingStrategy.LINE);
S_Entry.setlineWeight(3);
S_Entry.setdefaultColor(color.red);
S_Entry.hideBubble();
def SE =(if isNaN(S_Entry[1]) then S_Entry else Double.NaN);
addchartBubble(Entry_SL_Bubbles and S_Entry, SE,"S/E",color.RED,0);
#Short Stoploss
rec line2 = if IsNaN(MA_Max) then line2[1] else MA_Max[0];
plot S_stoploss = if IsNaN(MA_MAX) then line2 else double.nan;
S_stoploss.setpaintingStrategy(paintingStrategy.LINE);
S_stoploss.setlineWeight(3);
S_stoploss.setdefaultColor(color.dark_red);
S_stoploss.hideBubble();
def SSL =(if isNaN(S_stoploss[1]) then S_stoploss else Double.NaN);
addchartBubble(Entry_SL_Bubbles and S_stoploss, SSL,"S/SL :-" + AsDollars((S_Stoploss - S_Entry) * Point),color.DARK_RED);
#HalfX Long
plot x1a_Long = if Targetlines then (L_Entry +(L_Entry - L_Stoploss)/2) else double.nan;
x1a_Long.setpaintingStrategy(paintingStrategy.dashes);
x1a_Long.setlineWeight(1);
x1a_Long.setdefaultColor(color.magenta);
x1a_Long.hideBubble();
def X1aL =(if isNaN(x1a_Long[1]) then x1a_Long else Double.NaN);
addchartBubble(Target_Bubbles and x1a_Long, x1aL,"" + AsDollars((x1a_Long - L_Entry) * Point),color.magenta);
#OneX Long
plot x1_Long = if Targetlines and x1a_Long > line4 then (L_Entry +(L_Entry - L_Stoploss)) else double.nan;
x1_Long.setpaintingStrategy(paintingStrategy.dashes);
x1_Long.setlineWeight(1);
x1_Long.setdefaultColor(color.yellow);
def X1L =(if isNaN(x1_Long[1]) then x1_Long else Double.NaN);
addchartBubble(Target_Bubbles and x1_Long, x1L,"" + AsDollars((x1_Long - L_Entry) * Point),color.yellow);
#TwoX Long
plot x2_Long = if Targetlines then x1_Long +(L_Entry - L_Stoploss) else double.nan;
x2_Long.setpaintingStrategy(paintingStrategy.line);
x2_Long.setlineWeight(2);
x2_Long.setdefaultColor(color.light_red);
def X2L =(if isNaN(x2_Long[1]) then x2_Long else Double.NaN);
addchartBubble(Target_Bubbles and x2_Long, x2L,"" + AsDollars((x2_Long - L_Entry) * Point),color.light_red);
#ThreeX Long
plot x3_Long = if Targetlines then x2_Long +(L_Entry - L_Stoploss) else double.nan;
x3_Long.setpaintingStrategy(paintingStrategy.dashes);
x3_Long.setlineWeight(1);
x3_Long.setdefaultColor(color.cyan);
def X3L =(if isNaN(x3_Long[1]) then x3_Long else Double.NaN);
addchartBubble(Target_Bubbles and x3_Long, x3L,"" + AsDollars((x3_Long - L_Entry) * Point) ,color.cyan);
#FourX Long
plot x4_Long = if Targetlines then x3_Long +(L_Entry - L_Stoploss) else double.nan;
x4_Long.setpaintingStrategy(paintingStrategy.dashes);
x4_Long.setlineWeight(1);
x4_Long.setdefaultColor(color.white);
def X4L =(if isNaN(x4_Long[1]) then x4_Long else Double.NaN);
addchartBubble(Target_Bubbles and x4_Long, x4L,"" + AsDollars((x4_Long - L_Entry) * Point),color.white);
#HalfX Short
plot x1a_Short = if Targetlines then (S_Entry -(S_Stoploss - S_Entry)/2) else double.nan;
x1a_Short.setpaintingStrategy(paintingStrategy.dashes);
x1a_Short.setlineWeight(1);
x1a_Short.setdefaultColor(color.magenta);
x1a_Short.hideBubble();
def X1AS =(if isNaN(x1a_Short[1]) then x1a_Short else Double.NaN);
addchartBubble(Target_Bubbles and x1a_Short, x1aS,"" +AsDollars((S_Entry - x1a_Short) * Point),color.magenta,0);
#OneX Short
plot x1_Short = if Targetlines and x1a_short < line3 then (S_Entry -(S_Stoploss - S_Entry)) else double.nan;
x1_Short.setpaintingStrategy(paintingStrategy.dashes);
x1_Short.setlineWeight(1);
x1_Short.setdefaultColor(color.yellow);
def X1S =(if isNaN(x1_Short[1]) then x1_Short else Double.NaN);
addchartBubble(Target_Bubbles and x1_Short, x1S,"" + AsDollars((S_Entry - x1_Short) * Point),color.yellow,0);
#TwoX Short
plot x2_Short = if Targetlines then x1_Short -(S_Stoploss - S_Entry) else double.nan;
x2_Short.setpaintingStrategy(paintingStrategy.line);
x2_Short.setlineWeight(2);
x2_Short.setdefaultColor(color.light_green);
def X2S =(if isNaN(x2_Short[1]) then x2_Short else Double.NaN);
addchartBubble(Target_Bubbles and x2_Short, x2S,"" + AsDollars((S_Entry - x2_Short) * Point),color.light_green,0);
#ThreeX Short
plot x3_Short = if Targetlines then x2_Short -(S_Stoploss - S_Entry) else double.nan;
x3_Short.setpaintingStrategy(paintingStrategy.dashes);
x3_Short.setlineWeight(1);
x3_Short.setdefaultColor(color.cyan);
def X3S =(if isNaN(x3_Short[1]) then x3_Short else Double.NaN);
addchartBubble(Target_Bubbles and x3_Short, x3S,"" + AsDollars((S_Entry - x3_Short) * Point),color.cyan,0);
#FourX Short
plot x4_Short = if Targetlines then x3_Short -(S_Stoploss - S_Entry) else double.nan;
x4_Short.setpaintingStrategy(paintingStrategy.dashes);
x4_Short.setlineWeight(1);
x4_Short.setdefaultColor(color.white);
def X4S =(if isNaN(x4_Short[1]) then x4_Short else Double.NaN);
addchartBubble(Target_Bubbles and x4_Short, x4S,"" + AsDollars((S_Entry - x4_Short) * Point),color.white,0);
#LinearRegCh100 RegressionDivergence - Trigger Lines - Trend Cross
# From Lizard Indicators Link: https://www.lizardindicators.com/trigger-lines-cross-vs-thrust/
# Line #1 - Fast = LinReg (80)
# Line #2 - Slow = EXPEMA[LinReg (80)]
input LinRegLength = 80;
input EMAlength = 20;
#input ColorOn = yes;
#Definitions
def price1 = close;
def displace = 0;
def LinReg = Inertia(price1[-displace], LinRegLength);
def EMA_LR = ExpAverage(LinReg[-displace], EMAlength);
def Body = (open + close)/2;
# Defining Long/Short Filters (these instructions determine entries / exits)
# Entry Requirements
def Long_Entry = close > LinReg and close > EMA_LR and body > LinReg and body > EMA_LR and close > high[1] and body > body[1];
# LinReg > LinReg[1] and
def Long_Stay_In = close > LinReg and close > EMA_LR;
def Long_Exit = (close < LinReg or close < EMA_LR) or Long_Stay_In == 0;
def Long_State = If Long_Entry then 1 else if Long_Exit then 0 else Long_State[1];
def Long1 = Long_State;
# Exit Requirements
def Short_Entry = close < LinReg and close < EMA_LR and body < LinReg and body < EMA_LR and close < low[1] and body < body[1];
# LinReg < LinReg[1] and
def Short_Stay_In = close < LinReg and close < EMA_LR;
def Short_Exit = (close > LinReg or close > EMA_LR) or Short_Stay_In == 0;
def Short_State = If Short_Entry then 1 else if Short_Exit then 0 else Short_State[1];
def Short1 = Short_State;
#Adding Linear Regression averages
plot LR = LinReg;
LR.SetDefaultColor(CreateColor(0, 130, 255));
plot EMA_LinReg = EMA_LR;
EMA_LinReg.SetDefaultColor(CreateColor(255, 215,0));
LR.setlineweight(1);
EMA_LinReg.setlineweight(1);
#DYNO Label
AddLabel(yes and labels and Short1, "DYNO:BEARISH", color.RED);
AddLabel(yes and labels and Long1, "DYNO:BULLISH", color.green);
AddLabel(yes and labels and Long1 == Short1, "DYNO:NEUTRAL", color.YELLOW);
#Regression Bands
input deviations1 = 1.38; #set your deviation units here.
input deviations = 2; #set your deviation units here.
input length = 500; #set your channel lookback period here.
def stdDeviation = StDevAll(price, length);
plot HighBand = if Bands then EMA_LinReg + deviations * stdDeviation else double.nan;
HighBand.SetDefaultColor(Color.red);
plot LowBand = if Bands then EMA_LinReg - deviations * stdDeviation else double.nan;
LowBand.SetDefaultColor(Color.green);
plot HighBand1 = if Bands then EMA_LinReg + deviations1 * stdDeviation else double.nan;
HighBand1.SetDefaultColor(Color.light_red);
plot LowBand1 = if Bands then EMA_LinReg - deviations1 * stdDeviation else double.nan;
#200 DAY MOVING AVERAGE
input lengthAvgEXP = 200;
input Num_Dev_Dn1 = -1.3;
input Num_Dev_up1 = 1.3;
input Num_Dev_Dn = -2.0;
input Num_Dev_up = 2.0;
input BB = yes;
def pricebb = close;
def averageType = AverageType.exponential;
def sDev = stdev(data = pricebb[-displace], length = lengthAvgEXP);
plot AvgExp = MovingAverage(averageType, data = pricebb[-displace], length = lengthAvgEXP);
plot LowerBand = if BB then AvgExp + num_Dev_Dn * sDev else double.nan;
plot UpperBand = if BB then AvgExp + num_Dev_Up * sDev else double.nan;
AvgExp.SetDefaultColor(Color.white);
AvgExp.setlineweight(2);
LowerBand.SetDefaultColor(Color.white);
UpperBand.SetDefaultColor(Color.white);
# Coloring Bars
#AssignPriceColor(if ColorON and Long_State then Color.GREEN else if ColorON and Short_State then Color.RED else Color.Yellow);
DefineGlobalColor("Bullish", Color.dark_Green);
DefineGlobalColor("Bearish", Color.dark_Red);
AddCloud(EMA_LR, LinReg, GlobalColor("Bearish"), GlobalColor("Bullish"));
#Label
#AddLabel(yes, Long_Entry +": $" + Long_Entry+ ": $" +PriceNETChange + ": " + AsPercent(PctChange), if PctChange >= 0 then Color.Green else if PctChange < 0 then Color.Red else Color.Gray);
###################
#
# ALERTS
#
###################
Alert(alertON and LongTrigger, "Long Entry", Alert.BAR, Sound.Ding);
Alert(alertON and ShortTrigger, "Short Entry", Alert.BAR, Sound.Ding);
Alert(alertON and Buysetup, "HULL Buy", Alert.BAR, Sound.Bell);
Alert(alertON and Sellsetup, "HULL Sell", Alert.BAR, Sound.Bell);
Alert(alertON and high > highband, "Short Band", Alert.BAR, Sound.Ding);
Alert(alertON and low < lowband, "Long Band", Alert.BAR, Sound.Ding);If you only have S_Stoploss after the AsDollars, then it'll show the price. That amount you see is if you traded a quantity of shares, what you are risking in the trade.@chewie76 this is great, I personally dont like a ton of stuff on my charts, but I just love the imagination here, this is incredible work. Does anyone know how I could replace this S/L data to be the actual price it would be? As you can see below the SL bubble says (1.04) for SPY, how can I make it so that it lists the actual price for that SL? View attachment 18872
View attachment 18873
I have commented a few things out, but here is the code:
Code:#Hull_SuperTrend_Trading_System # assembled by Chewie 4/10/2022 # many thanks to all the other noted contributors to this system. # SuperTrend Yahoo Finance Replica - Modified from Modius SuperTrend # Modified Modius ver. by RConner7 # Modified by Barbaros to replicate look from TradingView version # Modified by Barbaros to add EMA cross for bubbles and alerts # Modified by Barbaros to update bar color painting # v3.3 input Quantity = 1; input Target_Bubbles = no; input Entry_SL_Bubbles = no; input Targetlines = yes; input Labels = yes; input alertON = yes; input Bands = yes; input AvgType = AverageType.HULL; input STAtrMult = 2.75; input nATR = 12; def Point = (Quantity / ticksize()) * tickvalue(); def ATR = ATR("length" = nATR, "average type" = AvgType); def UP_Band_Basic = HL2 + (STAtrMult * ATR); def LW_Band_Basic = HL2 + (-STAtrMult * ATR); def UP_Band = if ((UP_Band_Basic < UP_Band[1]) or (close[1] > UP_Band[1])) then UP_Band_Basic else UP_Band[1]; def LW_Band = if ((LW_Band_Basic > LW_Band[1]) or (close[1] < LW_Band[1])) then LW_Band_Basic else LW_Band[1]; def ST = if ((ST[1] == UP_Band[1]) and (close < UP_Band)) then UP_Band else if ((ST[1] == UP_Band[1]) and (close > Up_Band)) then LW_Band else if ((ST[1] == LW_Band[1]) and (close > LW_Band)) then LW_Band else if ((ST[1] == LW_Band) and (close < LW_Band)) then UP_Band else LW_Band; plot Long = if close > ST then ST else Double.NaN; Long.AssignValueColor(Color.cyan); Long.SetLineWeight(3); plot Short = if close < ST then ST else Double.NaN; Short.AssignValueColor(Color.magenta); Short.SetLineWeight(3); def LongTrigger = isNaN(Long[1]) and !isNaN(Long); def ShortTrigger = isNaN(Short[1]) and !isNaN(Short); plot LongDot = if LongTrigger then ST else Double.NaN; LongDot.SetPaintingStrategy(PaintingStrategy.POINTS); LongDot.AssignValueColor(Color.cyan); LongDot.SetLineWeight(4); plot ShortDot = if ShortTrigger then ST else Double.NaN; ShortDot.SetPaintingStrategy(PaintingStrategy.POINTS); ShortDot.AssignValueColor(Color.magenta); ShortDot.SetLineWeight(4); AddChartBubble(Entry_SL_Bubbles and LongTrigger, ST, "BUY", Color.GREEN, no); AddChartBubble(Entry_SL_Bubbles and ShortTrigger, ST, "SELL", Color.RED, yes); #Super Trend Labels AddLabel(yes and labels and Long, "ST:LONG", color.CYAN); AddLabel(yes and labels and Short, "ST:SHORT", color.magenta); # # Hull Moving Average Concavity and Turning Points # # Author: Seth Urion (Mahsume) # Version: 2020-05-01 V4 # # Now with support for ToS Mobile # declare upper; input HMA_Length = 60; input lookback = 3; input arrows = no; def price = HL2; plot HMA = HullMovingAvg(price = price, length = HMA_Length); def delta = HMA[1] - HMA[lookback + 1]; def delta_per_bar = delta / lookback; def next_bar = HMA[1] + delta_per_bar; def concavity = if HMA > next_bar then 1 else -1; plot turning_point = if concavity[1] != concavity then HMA else double.nan; HMA.AssignValueColor(color = if concavity[1] == -1 then if HMA > HMA[1] then color.dark_orange else color.red else if HMA < HMA[1] then color.dark_green else color.green); HMA.SetLineWeight(3); input ColorON = yes; def Long_StateH = close > HMA; def Short_StateH = close < HMA; # Coloring Bars AssignPriceColor(if ColorON and Long_StateH then Color.GREEN else if ColorON and Short_StateH then Color.RED else Color.current); turning_point.SetLineWeight(2); turning_point.SetPaintingStrategy(paintingStrategy = PaintingStrategy.POINTS); turning_point.SetDefaultColor(color.white); plot MA_Max = if HMA[-1] < HMA and HMA > HMA[1] then HMA else Double.NaN; MA_Max.SetDefaultColor(Color.WHITE); MA_Max.SetPaintingStrategy(PaintingStrategy.SQUARES); MA_Max.SetLineWeight(5); plot MA_Min = if HMA[-1] > HMA and HMA < HMA[1] then HMA else Double.Nan; MA_Min.SetDefaultColor(Color.WHITE); MA_Min.SetPaintingStrategy(PaintingStrategy.TRIANGLES); MA_Min.SetLineWeight(5); def BuySetup = HMA > HMA[1] and HMA[1] < HMA[2]; def SellSetup = HMA < HMA[1] and HMA[1] > HMA[2]; plot sell = if arrows and turning_point and concavity == -1 then high else double.nan; sell.SetDefaultColor(Color.DARK_ORANGE); sell.SetPaintingStrategy(PaintingStrategy.ARROW_DOWN); sell.SetLineWeight(3); plot buy = if arrows and turning_point and concavity == 1 then low else double.nan; buy.SetDefaultColor(Color.CYAN); buy.SetPaintingStrategy(PaintingStrategy.ARROW_UP); buy.SetLineWeight(3); def divergence = HMA - next_bar; ################### # # 2020-05-01 # # MOBILE TOS SUPPORT # # Each color of the HMA needs to be a separate plot as ToS Mobile # lacks the ability to assign colors the way ToS Desktop does. # I recommend a plain colored HMA behind the line # Set the line color of the HMA above to gray or some neutral # # CCD_D -> ConCave Down and Decreasing # CCD_I -> ConCave Down and Increasing # CCU_D -> ConCave Up and Decreasing # CCU_I -> ConCave Up and Increasing # ################### plot CCD_D = if concavity == -1 and HMA < HMA[1] then HMA else double.nan; CCD_D.SetDefaultColor(Color.RED); CCD_D.SetLineWeight(1); plot CCD_I = if concavity == -1 and HMA >= HMA[1] then HMA else double.nan; CCD_I.SetDefaultColor(Color.DARK_ORANGE); CCD_I.SetLineWeight(1); plot CCU_D = if concavity == 1 and HMA <= HMA[1] then HMA else double.nan; CCU_D.SetDefaultColor(COLOR.DARK_GREEN); CCU_D.SetLineWeight(1); plot CCU_I = if concavity == 1 and HMA > HMA[1] then HMA else double.nan; CCU_I.SetDefaultColor(COLOR.GREEN); CCU_I.SetLineWeight(1); #Hull Label AddLabel(yes and labels and CCD_D, "HULL:SELL", color.RED); AddLabel(yes and labels and CCU_I, "HULL:BUY", color.green); AddLabel(yes and labels and CCU_D, "HULL:WEAK SELL", color.dark_green); AddLabel(yes and labels and CCD_I, "HULL:WEAK BUY", color.DARK_ORANGE); #Target lines # created by chewie #Long Entry rec line4 = if IsNaN(short) then line4[1] else short[0]; plot L_Entry = if IsNaN(short) then line4 else double.nan; L_Entry.setpaintingStrategy(paintingStrategy.LINE); L_Entry.setlineWeight(3); L_Entry.setdefaultColor(color.green); L_Entry.hideBubble(); def LE =(if isNaN(L_Entry[1]) then L_Entry else Double.NaN); addchartBubble(Entry_SL_Bubbles and L_Entry, LE,"L/E",color.GREEN); #Long Stoploss rec line = if IsNaN(MA_Min) then line[1] else MA_Min[0]; plot L_stoploss= if isnan(MA_Min) then line else double.nan; L_stoploss.setpaintingStrategy(paintingStrategy.LINE); L_stoploss.setlineWeight(3); L_stoploss.setdefaultColor(color.dark_green); L_stoploss.hideBubble(); def LSL =(if isNaN(L_stoploss[1]) then L_stoploss else Double.NaN); addchartBubble(Entry_SL_Bubbles and L_stoploss, LSL,"L/SL : -" + AsDollars((L_Entry - L_stoploss) * Point),color.DARK_GREEN); #Short Entry rec line3 = if IsNaN(long) then line3[1] else long[0]; plot S_Entry = if IsNaN(long) then line3 else double.nan; S_Entry.setpaintingStrategy(paintingStrategy.LINE); S_Entry.setlineWeight(3); S_Entry.setdefaultColor(color.red); S_Entry.hideBubble(); def SE =(if isNaN(S_Entry[1]) then S_Entry else Double.NaN); addchartBubble(Entry_SL_Bubbles and S_Entry, SE,"S/E",color.RED,0); #Short Stoploss rec line2 = if IsNaN(MA_Max) then line2[1] else MA_Max[0]; plot S_stoploss = if IsNaN(MA_MAX) then line2 else double.nan; S_stoploss.setpaintingStrategy(paintingStrategy.LINE); S_stoploss.setlineWeight(3); S_stoploss.setdefaultColor(color.dark_red); S_stoploss.hideBubble(); def SSL =(if isNaN(S_stoploss[1]) then S_stoploss else Double.NaN); addchartBubble(Entry_SL_Bubbles and S_stoploss, SSL,"S/SL :-" + AsDollars((S_Stoploss - S_Entry) * Point),color.DARK_RED); #HalfX Long plot x1a_Long = if Targetlines then (L_Entry +(L_Entry - L_Stoploss)/2) else double.nan; x1a_Long.setpaintingStrategy(paintingStrategy.dashes); x1a_Long.setlineWeight(1); x1a_Long.setdefaultColor(color.magenta); x1a_Long.hideBubble(); def X1aL =(if isNaN(x1a_Long[1]) then x1a_Long else Double.NaN); addchartBubble(Target_Bubbles and x1a_Long, x1aL,"" + AsDollars((x1a_Long - L_Entry) * Point),color.magenta); #OneX Long plot x1_Long = if Targetlines and x1a_Long > line4 then (L_Entry +(L_Entry - L_Stoploss)) else double.nan; x1_Long.setpaintingStrategy(paintingStrategy.dashes); x1_Long.setlineWeight(1); x1_Long.setdefaultColor(color.yellow); def X1L =(if isNaN(x1_Long[1]) then x1_Long else Double.NaN); addchartBubble(Target_Bubbles and x1_Long, x1L,"" + AsDollars((x1_Long - L_Entry) * Point),color.yellow); #TwoX Long plot x2_Long = if Targetlines then x1_Long +(L_Entry - L_Stoploss) else double.nan; x2_Long.setpaintingStrategy(paintingStrategy.line); x2_Long.setlineWeight(2); x2_Long.setdefaultColor(color.light_red); def X2L =(if isNaN(x2_Long[1]) then x2_Long else Double.NaN); addchartBubble(Target_Bubbles and x2_Long, x2L,"" + AsDollars((x2_Long - L_Entry) * Point),color.light_red); #ThreeX Long plot x3_Long = if Targetlines then x2_Long +(L_Entry - L_Stoploss) else double.nan; x3_Long.setpaintingStrategy(paintingStrategy.dashes); x3_Long.setlineWeight(1); x3_Long.setdefaultColor(color.cyan); def X3L =(if isNaN(x3_Long[1]) then x3_Long else Double.NaN); addchartBubble(Target_Bubbles and x3_Long, x3L,"" + AsDollars((x3_Long - L_Entry) * Point) ,color.cyan); #FourX Long plot x4_Long = if Targetlines then x3_Long +(L_Entry - L_Stoploss) else double.nan; x4_Long.setpaintingStrategy(paintingStrategy.dashes); x4_Long.setlineWeight(1); x4_Long.setdefaultColor(color.white); def X4L =(if isNaN(x4_Long[1]) then x4_Long else Double.NaN); addchartBubble(Target_Bubbles and x4_Long, x4L,"" + AsDollars((x4_Long - L_Entry) * Point),color.white); #HalfX Short plot x1a_Short = if Targetlines then (S_Entry -(S_Stoploss - S_Entry)/2) else double.nan; x1a_Short.setpaintingStrategy(paintingStrategy.dashes); x1a_Short.setlineWeight(1); x1a_Short.setdefaultColor(color.magenta); x1a_Short.hideBubble(); def X1AS =(if isNaN(x1a_Short[1]) then x1a_Short else Double.NaN); addchartBubble(Target_Bubbles and x1a_Short, x1aS,"" +AsDollars((S_Entry - x1a_Short) * Point),color.magenta,0); #OneX Short plot x1_Short = if Targetlines and x1a_short < line3 then (S_Entry -(S_Stoploss - S_Entry)) else double.nan; x1_Short.setpaintingStrategy(paintingStrategy.dashes); x1_Short.setlineWeight(1); x1_Short.setdefaultColor(color.yellow); def X1S =(if isNaN(x1_Short[1]) then x1_Short else Double.NaN); addchartBubble(Target_Bubbles and x1_Short, x1S,"" + AsDollars((S_Entry - x1_Short) * Point),color.yellow,0); #TwoX Short plot x2_Short = if Targetlines then x1_Short -(S_Stoploss - S_Entry) else double.nan; x2_Short.setpaintingStrategy(paintingStrategy.line); x2_Short.setlineWeight(2); x2_Short.setdefaultColor(color.light_green); def X2S =(if isNaN(x2_Short[1]) then x2_Short else Double.NaN); addchartBubble(Target_Bubbles and x2_Short, x2S,"" + AsDollars((S_Entry - x2_Short) * Point),color.light_green,0); #ThreeX Short plot x3_Short = if Targetlines then x2_Short -(S_Stoploss - S_Entry) else double.nan; x3_Short.setpaintingStrategy(paintingStrategy.dashes); x3_Short.setlineWeight(1); x3_Short.setdefaultColor(color.cyan); def X3S =(if isNaN(x3_Short[1]) then x3_Short else Double.NaN); addchartBubble(Target_Bubbles and x3_Short, x3S,"" + AsDollars((S_Entry - x3_Short) * Point),color.cyan,0); #FourX Short plot x4_Short = if Targetlines then x3_Short -(S_Stoploss - S_Entry) else double.nan; x4_Short.setpaintingStrategy(paintingStrategy.dashes); x4_Short.setlineWeight(1); x4_Short.setdefaultColor(color.white); def X4S =(if isNaN(x4_Short[1]) then x4_Short else Double.NaN); addchartBubble(Target_Bubbles and x4_Short, x4S,"" + AsDollars((S_Entry - x4_Short) * Point),color.white,0); #LinearRegCh100 RegressionDivergence - Trigger Lines - Trend Cross # From Lizard Indicators Link: https://www.lizardindicators.com/trigger-lines-cross-vs-thrust/ # Line #1 - Fast = LinReg (80) # Line #2 - Slow = EXPEMA[LinReg (80)] input LinRegLength = 80; input EMAlength = 20; #input ColorOn = yes; #Definitions def price1 = close; def displace = 0; def LinReg = Inertia(price1[-displace], LinRegLength); def EMA_LR = ExpAverage(LinReg[-displace], EMAlength); def Body = (open + close)/2; # Defining Long/Short Filters (these instructions determine entries / exits) # Entry Requirements def Long_Entry = close > LinReg and close > EMA_LR and body > LinReg and body > EMA_LR and close > high[1] and body > body[1]; # LinReg > LinReg[1] and def Long_Stay_In = close > LinReg and close > EMA_LR; def Long_Exit = (close < LinReg or close < EMA_LR) or Long_Stay_In == 0; def Long_State = If Long_Entry then 1 else if Long_Exit then 0 else Long_State[1]; def Long1 = Long_State; # Exit Requirements def Short_Entry = close < LinReg and close < EMA_LR and body < LinReg and body < EMA_LR and close < low[1] and body < body[1]; # LinReg < LinReg[1] and def Short_Stay_In = close < LinReg and close < EMA_LR; def Short_Exit = (close > LinReg or close > EMA_LR) or Short_Stay_In == 0; def Short_State = If Short_Entry then 1 else if Short_Exit then 0 else Short_State[1]; def Short1 = Short_State; #Adding Linear Regression averages plot LR = LinReg; LR.SetDefaultColor(CreateColor(0, 130, 255)); plot EMA_LinReg = EMA_LR; EMA_LinReg.SetDefaultColor(CreateColor(255, 215,0)); LR.setlineweight(1); EMA_LinReg.setlineweight(1); #DYNO Label AddLabel(yes and labels and Short1, "DYNO:BEARISH", color.RED); AddLabel(yes and labels and Long1, "DYNO:BULLISH", color.green); AddLabel(yes and labels and Long1 == Short1, "DYNO:NEUTRAL", color.YELLOW); #Regression Bands input deviations1 = 1.38; #set your deviation units here. input deviations = 2; #set your deviation units here. input length = 500; #set your channel lookback period here. def stdDeviation = StDevAll(price, length); plot HighBand = if Bands then EMA_LinReg + deviations * stdDeviation else double.nan; HighBand.SetDefaultColor(Color.red); plot LowBand = if Bands then EMA_LinReg - deviations * stdDeviation else double.nan; LowBand.SetDefaultColor(Color.green); plot HighBand1 = if Bands then EMA_LinReg + deviations1 * stdDeviation else double.nan; HighBand1.SetDefaultColor(Color.light_red); plot LowBand1 = if Bands then EMA_LinReg - deviations1 * stdDeviation else double.nan; #200 DAY MOVING AVERAGE input lengthAvgEXP = 200; input Num_Dev_Dn1 = -1.3; input Num_Dev_up1 = 1.3; input Num_Dev_Dn = -2.0; input Num_Dev_up = 2.0; input BB = yes; def pricebb = close; def averageType = AverageType.exponential; def sDev = stdev(data = pricebb[-displace], length = lengthAvgEXP); plot AvgExp = MovingAverage(averageType, data = pricebb[-displace], length = lengthAvgEXP); plot LowerBand = if BB then AvgExp + num_Dev_Dn * sDev else double.nan; plot UpperBand = if BB then AvgExp + num_Dev_Up * sDev else double.nan; AvgExp.SetDefaultColor(Color.white); AvgExp.setlineweight(2); LowerBand.SetDefaultColor(Color.white); UpperBand.SetDefaultColor(Color.white); # Coloring Bars #AssignPriceColor(if ColorON and Long_State then Color.GREEN else if ColorON and Short_State then Color.RED else Color.Yellow); DefineGlobalColor("Bullish", Color.dark_Green); DefineGlobalColor("Bearish", Color.dark_Red); AddCloud(EMA_LR, LinReg, GlobalColor("Bearish"), GlobalColor("Bullish")); #Label #AddLabel(yes, Long_Entry +": $" + Long_Entry+ ": $" +PriceNETChange + ": " + AsPercent(PctChange), if PctChange >= 0 then Color.Green else if PctChange < 0 then Color.Red else Color.Gray); ################### # # ALERTS # ################### Alert(alertON and LongTrigger, "Long Entry", Alert.BAR, Sound.Ding); Alert(alertON and ShortTrigger, "Short Entry", Alert.BAR, Sound.Ding); Alert(alertON and Buysetup, "HULL Buy", Alert.BAR, Sound.Bell); Alert(alertON and Sellsetup, "HULL Sell", Alert.BAR, Sound.Bell); Alert(alertON and high > highband, "Short Band", Alert.BAR, Sound.Ding); Alert(alertON and low < lowband, "Long Band", Alert.BAR, Sound.Ding);
I found that I had to have at least one of them plotted for it to work. I picked that one. I tried, but not sure how to hide it and get it to still work.One last question/favor, how come the short target pops up even with price above the Short Entry plot? Is there a way where that does not show unless price is below the Short Entry? Thanks!!
View attachment 18876
IMO, You don't. You let it go and wait for another entry. Not worth the risk most of the time.Thanks for all your work, time and expertise that you have poured in to helping us all. Question: Lets say I missed the initial entry on SPY and It looks like it may continue going up. How do you decide to buy SPY after missing initial entry? Thanks
I'd wait for another setup. Remember to trade in the direction of the 200.Thanks for all your work, time and expertise that you have poured in to helping us all. Question: Lets say I missed the initial entry on SPY and It looks like it may continue going up. How do you decide to buy SPY after missing initial entry? Thanks
Thanks for your advice.I'd wait for another setup. Remember to trade in the direction of the 200.
https://usethinkscript.com/threads/...ystem-for-thinkorswim.10894/page-5#post-97511This has been a useful thread for me. I borrowed @chewie76 supertrend indicator. I'm having difficulty setting up a scan that informs me that a trend has gone in the opposite direction. In other words, a long trend would begin when the price breaks above the short trend. How can I scan for that event? Tried using LongDot and ShortDot but it didn't work properly. This is the code:
#Hull_SuperTrend_Trading_System
# assembled by Chewie 4/10/2022
input Target_Bubbles = no;
input Entry_SL_Bubbles = no;
input Targetlines = yes;
input Labels = yes;
input alertON = yes;
input Bands = yes;
input AvgType = AverageType.HULL;
input STAtrMult = 2.75;
input nATR = 12;
#======== Calculate the Supertrend =====================================================
def ATR = ATR("length" = nATR, "average type" = AvgType);
def UP_Band_Basic = HL2 + (STAtrMult * ATR);
def LW_Band_Basic = HL2 + (-STAtrMult * ATR);
def UP_Band = if ((UP_Band_Basic < UP_Band[1]) or (close[1] > UP_Band[1])) then UP_Band_Basic else UP_Band[1];
def LW_Band = if ((LW_Band_Basic > LW_Band[1]) or (close[1] < LW_Band[1])) then LW_Band_Basic else LW_Band[1];
def ST = if ((ST[1] == UP_Band[1]) and (close < UP_Band)) then UP_Band
else if ((ST[1] == UP_Band[1]) and (close > Up_Band)) then LW_Band
else if ((ST[1] == LW_Band[1]) and (close > LW_Band)) then LW_Band
else if ((ST[1] == LW_Band) and (close < LW_Band)) then UP_Band
else LW_Band;
plot Long = if close > ST then ST else Double.NaN;
Long.AssignValueColor(Color.cyan);
Long.SetLineWeight(3);
plot Short = if close < ST then ST else Double.NaN;
Short.AssignValueColor(Color.magenta);
Short.SetLineWeight(3);
def LongTrigger = isNaN(Long[1]) and !isNaN(Long);
def ShortTrigger = isNaN(Short[1]) and !isNaN(Short);
plot LongDot = if LongTrigger then ST else Double.NaN;
LongDot.SetPaintingStrategy(PaintingStrategy.POINTS);
LongDot.AssignValueColor(Color.cyan);
LongDot.SetLineWeight(4);
plot ShortDot = if ShortTrigger then ST else Double.NaN;
ShortDot.SetPaintingStrategy(PaintingStrategy.POINTS);
ShortDot.AssignValueColor(Color.magenta);
ShortDot.SetLineWeight(4);
AddChartBubble(Entry_SL_Bubbles and LongTrigger, ST, "BUY", Color.GREEN, no);
AddChartBubble(Entry_SL_Bubbles and ShortTrigger, ST, "SELL", Color.RED, yes);
#Super Trend Labels
AddLabel(yes and labels and Long, "ST:LONG", color.CYAN);
AddLabel(yes and labels and Short, "ST:SHORT", color.magenta);
#======== End of Supertrend calcs
Start a new thread and receive assistance from our community.
useThinkScript is the #1 community of stock market investors using indicators and other tools to power their trading strategies. Traders of all skill levels use our forums to learn about scripting and indicators, help each other, and discover new ways to gain an edge in the markets.
We get it. Our forum can be intimidating, if not overwhelming. With thousands of topics, tens of thousands of posts, our community has created an incredibly deep knowledge base for stock traders. No one can ever exhaust every resource provided on our site.
If you are new, or just looking for guidance, here are some helpful links to get you started.