My recent discovery in terms of trading learning materials is "YTC Price Action Trader" book. It contains numerous invaluable clues, which I couldn't find anywhere else. One YTC chapter covers Candle Sentiment analysis. Watching where 'close' of the candle happens can give early hints about future market action. Most of time you get those hints before the indicators provide it.
Close Sentiment: This is single-candle analysis. Divide entire range of a candle (low to high) into 3 equal parts. The candle is:
Close Comparison: Compare position of 'close' with entire range of the previous candle. The candle is:
- "High Close" - if 'close' is in the upper 1/3
- "Mid Close" - if 'close' is in the middle 1/3
- "Low Close" - if 'close' is in the lower 1/3
What can you do with this? It gives very good and early reversal hints. Mid/ranging signals should be considered "no signals" - in other words: market will continue in the same direction.
- Bull Candle - if 'close' is above 'high' of the previous candle
- Range Candle - if 'close' is between 'high' and 'low' of the previous candle
- Bear Candle - if 'close' is below 'low' of the previous candle
thinkScript Code
Code:
# YTC Candlestick Sentiment
# Assembled by BenTen at useThinkScript.com
# Converted from https://www.tradingview.com/script/5fSgjYoM-YTC-Candlestick-Sentiment/
def highclose = (close - low) >= (2 * (high - low) / 3);
def midclose=(close-low)>((high-low)/3) and (close-low)<(2* (high-low)/3);
def lowclose = (close - low) <= ((high - low) / 3);
def YTCbullcandle = close > high[1];
def YTCrangecandle = close < high[1] and close>low[1];
def YTCbearcandle = close < low[1];
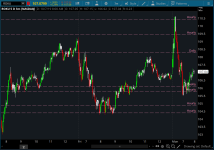
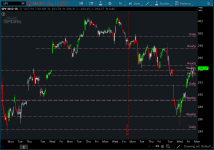
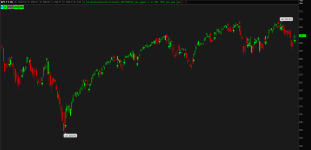
assignPriceColor(if YTCbullcandle then Color.GREEN else if YTCbearcandle then Color.RED else Color.WHITE);