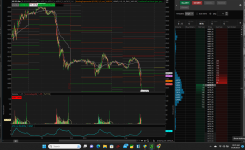
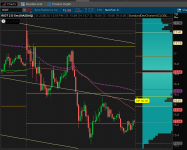
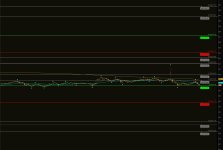
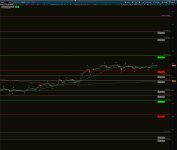
Hi Wiinii,This is a complete trading strategy indicator built around Thor Young's book A Complete Day Trading System.
It includes:
Shared Link: http://tos.mx/ZSLIuJR (or use code below). Click here for --> Easiest way to load shared links
- Camarilla Pivot Points - Both with and without premarket data.
- Label on chart showing whether to use cams with or without PMD. See animated gif.
- Auto option shows only the cams needed based on the above! Optionally show both cams with and without PMD at all times, or only one or the other. NOTE: You need at least 2 days data on your charts for w/PMD cams (3 on 3-day holiday weekends).
- Floor Pivots 3, 4, and Central. (Can be toggled on and off).
- Option to hide cam levels 1, 2 and 5 (hidden by default).
- Use the bubblemover settings to put the bubbles where you want them on the chart (w one is for w/PMD).
- S/R4a and S/R4wa are optional, but it allows the dual colors for those levels which you'll see by default. I recommend making the green S4 lines slightly thicker than the red (ex. red 1 green 2) for it to look best.
To complement this, I've also created the Volume-Colored Candles w/VPA Reversal Candle Anomaly Detector for ThinkOrSwim!
Scanners and Watchlist Columns are at the bottom of this post!
Other indicators I also use/recommend:
- Previous Day High/Low/Close + Premarket High/Low + High/Low of Day for ThinkorSwim
- Previous Candle High/Low Labels & Bubbles For ThinkOrSwim
- Multi-TimeFrame Candles Overlay for ThinkOrSwim - Eg. See the 1min and 5min candles on a single chart!
- Spread Label on Chart
- ATR on Chart - Also works perfect for Ed Martin's strategy, just put it on the 5min chart and set atr period: 6 and period: 5m.
- TICK Divergence - Lower study that shows the TICK and volume/price divergence.
- Multi-timeframe (MTF) Moving Average Indicator for ThinkorSwim - Put the daily MAs on your lower timeframe charts, or see the 5min 9/20 MAs on your 1min chart!
- Volume/Price Divergence - Shows arrows and gives alerts on volume anomalies/digergence.


Code:# TD Ameritrade IP Company, Inc. (c) 2013-2021 # Some code based on code by SleepyZ & Nube # Built by Wiinii and based on Thor's book 'A Complete Day Trading System' to include R5 & S5, levels colored accordingly, CAMS with pre-market data, Central Pivot + Floor Pivots 3&4, and label to easily tell you if you should use With or W/O Premarket Data and option only to show the cams based on that! # https://usethinkscript.com/threads/pivot-day-trading-system-for-thinkorswim.12988/ declare once_per_bar; input aggregationPeriod = {default "DAY", "WEEK", "MONTH"}; input length = 1; input ShowBubbles = yes; input ShowPricesInBubbles = yes; input PMD_Indicator_Label = yes; input ShowCams = {default "Auto", "Both", "w/o Only", "w/Only"}; input hide_Floor_Pivots = no; input hide_s4a_r4a = no; input hide_s1_r1 = yes; input hide_s2_r2 = yes; input hide_s5_r5 = yes; input lines = {default horizontal, dashes, points, triangles, squares}; Assert(length > 0, "'length' should be positive: " + length); def yyyymmdd = GetYYYYMMDD(); def month = GetYear() * 12 + GetMonth(); def day_number = DaysFromDate(First(yyyymmdd)) + GetDayOfWeek(First(yyyymmdd)); def period; switch (aggregationPeriod) { case DAY: period = CountTradingDays(Min(First(yyyymmdd), yyyymmdd), yyyymmdd) - 1; case WEEK: period = Floor(day_number / 7); case MONTH: period = Floor(month - First(month)); } def count = CompoundValue(1, if period != period[1] then (count[1] + period - period[1]) % length else count[1], 0); def start = CompoundValue(1, count < count[1] + period - period[1], yes); def highValue = if start then Highest(high(period = aggregationPeriod), length)[1] else if highValue[1] != 0 then highValue[1] else Double.NaN; def lowValue = if start then Lowest(low(period = aggregationPeriod), length)[1] else if lowValue[1] != 0 then lowValue[1] else Double.NaN; def closeValue = if start then close(period = aggregationPeriod)[1] else closeValue[1]; def range = highValue - lowValue; #PMD Indicator Label on Chart ---------------------------------------------- def na = Double.NaN; def bn = BarNumber(); def h = high; def l = low; Script prior { # subscript for getting prior value of a BarNumber() defined variable input prior = close; def priorOf = if prior != prior[1] then prior[1] else priorOf[1]; plot priorBar = priorOf; } # variables def cb = HighestAll(if !IsNaN(h) then bn else na); def time = GetTime(); def rts = RegularTradingStart(GetYYYYMMDD()); def rte = RegularTradingEnd(GetYYYYMMDD()); def RTH = if time crosses above rts then bn else if time <= rts then bn else RTH[1]; def globex = if time crosses below rte then bn else globex[1]; def priorRTH = prior(RTH); def priorGlobex = prior(globex); def hRTH = HighestAll(RTH); def hGX = HighestAll(globex); def hPRTH = HighestAll(priorRTH); def hPGX = HighestAll(priorGlobex); def gXhigh = HighestAll(if bn >= hGX && bn < hRTH then h else if hRTH < hGX && bn >= hGX then h else na); def gXlow = LowestAll(if bn >= hGX && bn < hRTH then l else if hRTH < hGX && bn >= hGX then l else na); def priorGBXhigh = HighestAll(if bn >= hPGX && bn < if hGX < hRTH then hGX else hPGX then h else na); def priorGBXlow = LowestAll(if bn >= hPGX && bn < if hGX < hRTH then hGX else hPGX then l else na); def displace = -1; def PDHigh = Highest(high(period = aggregationPeriod)[-displace], length); def PDLow = Lowest(low(period = aggregationPeriod)[-displace], length); def PD_Close = close(period = aggregationPeriod)[1]; def tm = SecondsFromTime(00); Def gxClose = if tm crosses below tm[1] then close[1] else gxClose[1]; def wPMD = if gxclose == PD_Close then 0 else if gXhigh > PDHigh or gXlow < PDLow then 1 else 0; AddLabel (PMD_Indicator_Label, if wPMD then "w/PMD" else "w/o PMD", if wPMD then Color.GREEN else Color.PINK); #WITHOUT PM DATA ---------------------------------------------------------- plot R6 = (highValue / lowValue) * closeValue; plot R5 = (closeValue + range * (1.1) / 2) + 1.168 * ((closeValue + range * (1.1) / 2) – (closeValue + range * (1.1) / 4)); plot R4a = closeValue + range * (1.098) / 2; plot R4 = closeValue + range * (1.1) / 2; plot R3 = closeValue + range * (1.1) / 4; plot R2 = closeValue + range * (1.1) / 6; plot R1 = closeValue + range * (1.1) / 12; plot S1 = closeValue - range * (1.1) / 12; plot S2 = closeValue - range * (1.1) / 6; plot S3 = closeValue - range * (1.1) / 4; plot S4 = closeValue - range * (1.1) / 2; plot S4a = closeValue - range * (1.098) / 2; plot S5 = (closeValue - range * (1.1) / 2) - 1.168 * ((closeValue - range * (1.1) / 4) - (closeValue - range * (1.1) / 2)); plot S6 = (closeValue - (R6 - closeValue)); def hidewo = ShowCams == ShowCams."w/Only" or (ShowCams == ShowCams."Auto" and wPMD is true); R6.SetHiding(hidewo); R5.SetHiding(hide_s5_r5 or hidewo); R4.SetHiding(hidewo); R4a.SetHiding(hide_s4a_r4a or hidewo); R3.SetHiding(hidewo); R2.SetHiding(hide_s2_r2 or hidewo); R1.SetHiding(hide_s1_r1 or hidewo); S1.SetHiding(hide_s1_r1 or hidewo); S2.SetHiding(hide_s2_r2 or hidewo); S3.SetHiding(hidewo); S4.SetHiding(hidewo); S4a.SetHiding(hidewo); S5.SetHiding(hide_s5_r5 or hidewo); S6.SetHiding(hidewo); R6.SetDefaultColor(Color.RED); R5.SetDefaultColor(GetColor(7)); R4.SetDefaultColor(Color.GREEN); R4a.SetDefaultColor(Color.RED); R3.SetDefaultColor(Color.RED); R2.SetDefaultColor(GetColor(7)); R1.SetDefaultColor(GetColor(7)); S1.SetDefaultColor(GetColor(7)); S2.SetDefaultColor(GetColor(7)); S3.SetDefaultColor(Color.GREEN); S4.SetDefaultColor(Color.RED); S4a.SetDefaultColor(Color.GREEN); S5.SetDefaultColor(GetColor(7)); S6.SetDefaultColor(Color.GREEN); def paintingStrategy = if lines == lines.points then PaintingStrategy.POINTS else if lines == lines.triangles then PaintingStrategy.TRIANGLES else if lines == lines.dashes then PaintingStrategy.DASHES else if lines == lines.horizontal then PaintingStrategy.HORIZONTAL else PaintingStrategy.SQUARES; R6.SetPaintingStrategy(paintingStrategy); R5.SetPaintingStrategy(paintingStrategy); R4.SetPaintingStrategy(paintingStrategy); R4a.SetPaintingStrategy(paintingStrategy); R3.SetPaintingStrategy(paintingStrategy); R2.SetPaintingStrategy(paintingStrategy); R1.SetPaintingStrategy(paintingStrategy); S1.SetPaintingStrategy(paintingStrategy); S2.SetPaintingStrategy(paintingStrategy); S3.SetPaintingStrategy(paintingStrategy); S4.SetPaintingStrategy(paintingStrategy); S4a.SetPaintingStrategy(paintingStrategy); S5.SetPaintingStrategy(paintingStrategy); S6.SetPaintingStrategy(paintingStrategy); #Bubbles to describe Pivot Levels w/o Premarket Data -------------------------------------- input bubblemover = -20; def n = bubblemover; def n1 = n + 1; def StartPlot = if ShowBubbles == yes and ((ShowCams == ShowCams."Auto" and !wPMD is true or aggregationPeriod != aggregationPeriod."DAY") or ShowCams == ShowCams."Both" or ShowCams == ShowCams."w/o Only") then (IsNaN(close[n]) and !IsNaN(close[n1])) else Double.NaN; AddChartBubble(StartPlot, R6[n1], "R6 " + (if ShowPricesInBubbles then AsText(R6[n1]) else ""), Color.PINK, if close[n1] > R6[n1] then no else yes); AddChartBubble(StartPlot and hide_s5_r5 == no, R5[n1], "R5 " + (if ShowPricesInBubbles then AsText(R5[n1]) else ""), Color.GRAY, if close[n1] > R5[n1] then no else yes); AddChartBubble(StartPlot, R4[n1], "R4 " + (if ShowPricesInBubbles then AsText(R4[n1]) else ""), Color.ORANGE, if close[n1] > R4[n1] then no else yes); AddChartBubble(StartPlot, R3[n1], "R3 " + (if ShowPricesInBubbles then AsText(R3[n1]) else ""), Color.PINK, if close[n1] > R3[n1] then no else yes); AddChartBubble(StartPlot and hide_s2_r2 == no, R2[n1], "R2 " + (if ShowPricesInBubbles then AsText(R2[n1]) else ""), Color.GRAY, if close[n1] > R2[n1] then no else yes); AddChartBubble(StartPlot and hide_s1_r1 == no, R1[n1], "R1 " + (if ShowPricesInBubbles then AsText(R1[n1]) else ""), Color.GRAY, if close[n1] > R1[n1] then no else yes); AddChartBubble(StartPlot, S6[n1], "S6 " + (if ShowPricesInBubbles then AsText(S6[n1]) else ""), Color.LIGHT_GREEN, if close[n1] > S6[n1] then no else yes); AddChartBubble(StartPlot and hide_s5_r5 == no, S5[n1], "S5 " + (if ShowPricesInBubbles then AsText(S5[n1]) else ""), Color.GRAY, if close[n1] > S5[n1] then no else yes); AddChartBubble(StartPlot, S4[n1], "S4 " + (if ShowPricesInBubbles then AsText(S4[n1]) else ""), Color.ORANGE, if close[n1] > S4[n1] then no else yes); AddChartBubble(StartPlot, S3[n1], "S3 " + (if ShowPricesInBubbles then AsText(S3[n1]) else ""), Color.LIGHT_GREEN, if close[n1] > S3[n1] then no else yes); AddChartBubble(StartPlot and hide_s2_r2 == no, S2[n1], "S2 " + (if ShowPricesInBubbles then AsText(S2[n1]) else ""), Color.GRAY, if close[n1] > S2[n1] then no else yes); AddChartBubble(StartPlot and hide_s1_r1 == no, S1[n1], "S1 " + (if ShowPricesInBubbles then AsText(S1[n1]) else ""), Color.GRAY, if close[n1] > S1[n1] then no else yes); R1.HideBubble(); R2.HideBubble(); R3.HideBubble(); R4.HideBubble(); R4a.HideBubble(); R5.HideBubble(); R6.HideBubble(); S1.HideBubble(); S2.HideBubble(); S3.HideBubble(); S4.HideBubble(); S4a.HideBubble(); S5.HideBubble(); S6.HideBubble(); #WITH PREMARKET DATA------------------------------------------------------- #plot ExtClose = gxClose; #plot #PreviousHighGBX = priorGBXhigh; #PreviousHighGBX.SetDefaultColor(Color.green); #plot #PreviousLowGPX = priorGBXlow; #PreviousLowGPX.SetDefaultColor(Color.red); #plot #gbxClose = gxClose; #gbxClose.SetDefaultColor(Color.white); #AddChartBubble(ShowBubbles && bn == cb, priorGBXhigh, "pGBX High", Color.light_green); #AddChartBubble(ShowBubbles && bn == cb, priorGBXlow, "pGBX Low", Color.pink,0); #AddChartBubble(ShowBubbles && bn == cb, gxClose, "pGBX close", Color.white,0); #Plotting def rangew = priorGBXhigh - priorGBXlow; plot R6w = (priorGBXhigh / priorGBXlow) * gxClose; plot R5w = (gxClose + rangew * (1.1) / 2) + 1.168 * ((gxClose + rangew * (1.1) / 2) – (gxClose + rangew * (1.1) / 4)); plot R4wa = gxClose + rangew * (1.098) / 2; plot R4w = gxClose + rangew * (1.1) / 2; plot R3w = gxClose + rangew * (1.1) / 4; plot R2w = gxClose + rangew * (1.1) / 6; plot R1w = gxClose + rangew * (1.1) / 12; plot S1w = gxClose - rangew * (1.1) / 12; plot S2w = gxClose - rangew * (1.1) / 6; plot S3w = gxClose - rangew * (1.1) / 4; plot S4w = gxClose - rangew * (1.1) / 2; plot S4wa = gxClose - rangew * (1.098) / 2; plot S5w = (gxClose - rangew * (1.1) / 2) - 1.168 * ((gxClose - range * (1.1) / 4) - (gxClose - rangew * (1.1) / 2)); plot S6w = (gxClose - (R6w - gxClose)); def hidew = ShowCams == ShowCams."w/o Only" or (ShowCams == ShowCams."Auto" and !wPMD); R6w.SetHiding(hidew); R5w.SetHiding(hide_s5_r5 or hidew); R4w.SetHiding(hidew); R4wa.SetHiding(hidew); R3w.SetHiding(hidew); R2w.SetHiding(hide_s2_r2 or hidew); R1w.SetHiding(hide_s1_r1 or hidew); S1w.SetHiding(hide_s1_r1 or hidew); S2w.SetHiding(hide_s2_r2 or hidew); S3w.SetHiding(hidew); S4w.SetHiding(hidew); S4wa.SetHiding(hide_s4a_r4a or hidew); S5w.SetHiding(hide_s5_r5 or hidew); S6w.SetHiding(hidew); R6w.SetDefaultColor(Color.RED); R5w.SetDefaultColor(GetColor(7)); R4w.SetDefaultColor(Color.GREEN); R4wa.SetDefaultColor(Color.RED); R3w.SetDefaultColor(Color.RED); R2w.SetDefaultColor(GetColor(7)); R1w.SetDefaultColor(GetColor(7)); S1w.SetDefaultColor(GetColor(7)); S2w.SetDefaultColor(GetColor(7)); S3w.SetDefaultColor(Color.GREEN); S4w.SetDefaultColor(Color.RED); S4wa.SetDefaultColor(Color.GREEN); S5w.SetDefaultColor(GetColor(7)); S6w.SetDefaultColor(Color.GREEN); R6w.SetPaintingStrategy(paintingStrategy); R5w.SetPaintingStrategy(paintingStrategy); R4w.SetPaintingStrategy(paintingStrategy); R4wa.SetPaintingStrategy(paintingStrategy); R3w.SetPaintingStrategy(paintingStrategy); R2w.SetPaintingStrategy(paintingStrategy); R1w.SetPaintingStrategy(paintingStrategy); S1w.SetPaintingStrategy(paintingStrategy); S2w.SetPaintingStrategy(paintingStrategy); S3w.SetPaintingStrategy(paintingStrategy); S4w.SetPaintingStrategy(paintingStrategy); S4wa.SetPaintingStrategy(paintingStrategy); S5w.SetPaintingStrategy(paintingStrategy); S6w.SetPaintingStrategy(paintingStrategy); #Bubbles to describe Pivot Levels w/Premarket Data ------------------------------------ input w_bubblemover = -50; def n2 = w_bubblemover; def n3 = n2 + 1; def StartPlot2 = if ShowBubbles == yes and ((ShowCams == ShowCams."Auto" and wPMD) or ShowCams == ShowCams."Both" or ShowCams == ShowCams."w/Only") then (IsNaN(close[n2]) and !IsNaN(close[n3])) else Double.NaN; AddChartBubble(StartPlot2, R6w[n3], "R6w " + (if ShowPricesInBubbles then AsText(R6w[n3]) else ""), Color.PINK, if close[n3] > R6w[n3] then no else yes); AddChartBubble(StartPlot2 and hide_s5_r5 == no, R5w[n3], "R5w " + (if ShowPricesInBubbles then AsText(R5w[n3]) else ""), Color.GRAY, if close[n3] > R5w[n3] then no else yes); AddChartBubble(StartPlot2, R4w[n3], "R4w " + (if ShowPricesInBubbles then AsText(R4w[n3]) else ""), Color.ORANGE, if close[n3] > R4w[n3] then no else yes); AddChartBubble(StartPlot2, R3w[n3], "R3w " + (if ShowPricesInBubbles then AsText(R3w[n3]) else ""), Color.PINK, if close[n3] > R3w[n3] then no else yes); AddChartBubble(StartPlot2 and hide_s2_r2 == no, R2w[n3], "R2w " + (if ShowPricesInBubbles then AsText(R2w[n3]) else ""), Color.GRAY, if close[n3] > R2w[n3] then no else yes); AddChartBubble(StartPlot2 and hide_s1_r1 == no, R1w[n3], "R1w " + (if ShowPricesInBubbles then AsText(R1w[n3]) else ""), Color.GRAY, if close[n3] > R1w[n3] then no else yes); AddChartBubble(StartPlot2, S6w[n3], "S6w " + (if ShowPricesInBubbles then AsText(S6w[n3]) else ""), Color.LIGHT_GREEN, if close[n3] > S6w[n3] then no else yes); AddChartBubble(StartPlot2 and hide_s5_r5 == no, S5w[n3], "S5w " + (if ShowPricesInBubbles then AsText(S5w[n3]) else ""), Color.GRAY, if close[n3] > S5w[n3] then no else yes); AddChartBubble(StartPlot2, S4w[n3], "S4w " + (if ShowPricesInBubbles then AsText(S4w[n3]) else ""), Color.ORANGE, if close[n3] > S4w[n3] then no else yes); AddChartBubble(StartPlot2, S3w[n3], "S3w " + (if ShowPricesInBubbles then AsText(S3w[n3]) else ""), Color.LIGHT_GREEN, if close[n3] > S3w[n3] then no else yes); AddChartBubble(StartPlot2 and hide_s2_r2 == no, S2w[n3], "S2w " + (if ShowPricesInBubbles then AsText(S2w[n3]) else ""), Color.GRAY, if close[n3] > S2w[n3] then no else yes); AddChartBubble(StartPlot2 and hide_s1_r1 == no, S1w[n3], "S1w " + (if ShowPricesInBubbles then AsText(S1w[n3]) else ""), Color.GRAY, if close[n3] > S1w[n3] then no else yes); R1w.HideBubble(); R2w.HideBubble(); R3w.HideBubble(); R4w.HideBubble(); R4wa.HideBubble(); R5w.HideBubble(); R6w.HideBubble(); S1w.HideBubble(); S2w.HideBubble(); S3w.HideBubble(); S4w.HideBubble(); S4wa.HideBubble(); S5w.HideBubble(); S6w.HideBubble(); #Floor Pivots Add-on------------------------------------------------------------------ def PH = high(period = aggregationPeriod)[1]; def PL = low(period = aggregationPeriod)[1]; def PC = close(period = aggregationPeriod)[1]; def PP = (PH + PL + PC) / 3.0; def bc = (PH + PL) / 2.0; def tc = (PP - bc) + PP; plot FR4 = PH + (3 * (PP - PL)); plot FR3 = PH + (2 * (PP - PL)); plot CP = PP; plot FS3 = PL - (2 * (PH - PP)); plot FS4 = PL - (3 * (PH - PP)); FR4.SetHiding(hide_Floor_Pivots); FR3.SetHiding(hide_Floor_Pivots); CP.SetHiding(hide_Floor_Pivots); FS3.SetHiding(hide_Floor_Pivots); FS4.SetHiding(hide_Floor_Pivots); FR4.SetDefaultColor(CreateColor(102, 0, 204)); FR3.SetDefaultColor(Color.MAGENTA); CP.SetDefaultColor(Color.YELLOW); FS3.SetDefaultColor(Color.MAGENTA); FS4.SetDefaultColor(CreateColor(102, 0, 204)); FR4.SetPaintingStrategy(paintingStrategy); FR3.SetPaintingStrategy(paintingStrategy); CP.SetPaintingStrategy(paintingStrategy); FS3.SetPaintingStrategy(paintingStrategy); FS4.SetPaintingStrategy(paintingStrategy); def StartPlot3 = if ShowBubbles == yes and hide_Floor_Pivots == no then (IsNaN(close[n]) and !IsNaN(close[n1])) else Double.NaN; AddChartBubble(StartPlot3, CP[n1], "CP " + (if ShowPricesInBubbles then AsText(CP[n1]) else ""), Color.YELLOW, if close[n1] > CP[n1] then no else yes); AddChartBubble(StartPlot3, FR4[n1], "FR4 " + (if ShowPricesInBubbles then AsText(FR4[n1]) else ""), (CreateColor(102, 0, 204)), if close[n1] > FR4[n1] then no else yes); AddChartBubble(StartPlot3, FR3[n1], "FR3 " + (if ShowPricesInBubbles then AsText(FR3[n1]) else ""), Color.MAGENTA, if close[n1] > FR3[n1] then no else yes); AddChartBubble(StartPlot3, FS4[n1], "FS4 " + (if ShowPricesInBubbles then AsText(FS4[n1]) else ""), (CreateColor(102, 0, 204)), if close[n1] > FS4[n1] then no else yes); AddChartBubble(StartPlot3, FS3[n1], "FS3 " + (if ShowPricesInBubbles then AsText(FS3[n1]) else ""), Color.MAGENTA, if close[n1] > FS3[n1] then no else yes); FR4.HideBubble(); FR3.HideBubble(); CP.HideBubble(); FS3.HideBubble(); FS4.HideBubble();
Scanners and Watchlist Columns:
To change the % of how close to or far from a cam level to scan or have your watchlist column turn green, just change the 'z <= .2 and z >= -.2' to whatever you please. Note that the codes below are based on the built-in ToS cam study, to scan mine instead just change the 'CamarillaPoints' in the codes to whatever you named my study.
Scanners:
Near Daily cam levels.
Near Monthly cam levels
Watchlist Columns:
Rather than posting 8 watchlist columns, I'm going to share an example of each. Just change all 4 places in the code to other cam levels like R4 or whatnot.
Daily S4:
Code:def s4 = CamarillaPoints(length = 1).s4 ; def diff = close - s4 ; def diff_per = round(100 * diff/s4, 1); plot z = diff_per; assignBackgroundColor(if z <= .2 and z >= -.2 then color.dark_green else color.dark_red)
Montly S4:
Code:def s4 = CamarillaPoints("aggregation period" = "MONTH", "length" = 1).s4 ; def diff = close - s4 ; def diff_per = round(100 * diff/s4, 1); plot z = diff_per; assignBackgroundColor(if z <= 1 and z >= -1 then color.dark_green else color.dark_red);

Can you help me understand the different cam levels you created? I am on chapter 3 in the book, so it's possible I haven't gotten far enough to understand. I understand the "normal" cam levels (e.g., S6-R6), but I don't know where the additional levels are from. Are these based on the traditional floor pivots Thor discusses in his book?
If there is a resource that explains, please let me know. It's possible I missed it or haven't seen yet.
Thanks,
saint2022


