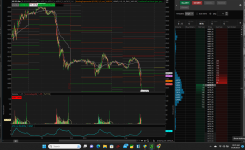
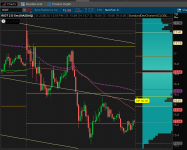
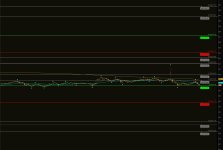
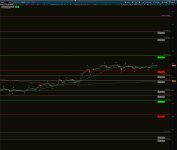
Camarilla Pivot Points Day Trading System For ThinkOrSwim

This is a complete trading strategy indicator built around Thor Young's book A Complete Day Trading System.

It includes:
  • Camarilla Pivot Points - Both with and without premarket data.
  • Label on chart showing whether to use cams with or without PMD. See animated gif.
  • Auto option shows only the cams needed based on the above! Optionally show both cams with and without PMD at all times, or only one or the other. NOTE: You need at least 2 days data on your charts for w/PMD cams (3 on 3-day holiday weekends).
  • Floor Pivots 3, 4, and Central. (Can be toggled on and off).
  • Option to hide cam levels 1, 2 and 5 (hidden by default).
  • Use the bubblemover settings to put the bubbles where you want them on the chart (w one is for w/PMD).
  • S/R4a and S/R4wa are optional, but it allows the dual colors for those levels which you'll see by default. I recommend making the green S4 lines slightly thicker than the red (ex. red 1 green 2) for it to look best.
Shared Link: http://tos.mx/ZSLIuJR (or use code below). Click here for --> Easiest way to load shared links

To complement this, I've also created the Volume-Colored Candles w/VPA Reversal Candle Anomaly Detector for ThinkOrSwim!

Scanners and Watchlist Columns are at the bottom of this post!

Other indicators I also use/recommend:

3TbBZow.png


3TeUn0c.png


Code:
# TD Ameritrade IP Company, Inc. (c) 2013-2021
# Some code based on code by SleepyZ & Nube
# Built by Wiinii and based on Thor's book 'A Complete Day Trading System' to include R5 & S5, levels colored accordingly, CAMS with pre-market data, Central Pivot + Floor Pivots 3&4, and label to easily tell you if you should use With or W/O Premarket Data and option only to show the cams based on that!
# https://usethinkscript.com/threads/pivot-day-trading-system-for-thinkorswim.12988/

declare once_per_bar;

input aggregationPeriod = {default "DAY", "WEEK", "MONTH"};
input length = 1;
input ShowBubbles = yes;
input ShowPricesInBubbles = yes;
input PMD_Indicator_Label = yes;
input ShowCams = {default "Auto", "Both", "w/o Only", "w/Only"};
input hide_Floor_Pivots = no;
input hide_s4a_r4a = no;
input hide_s1_r1 = yes;
input hide_s2_r2 = yes;
input hide_s5_r5 = yes;
input lines = {default horizontal, dashes, points, triangles, squares};

Assert(length > 0, "'length' should be positive: " + length);

def yyyymmdd = GetYYYYMMDD();
def month = GetYear() * 12 + GetMonth();
def day_number = DaysFromDate(First(yyyymmdd)) + GetDayOfWeek(First(yyyymmdd));
def period;
switch (aggregationPeriod) {
case DAY:
    period = CountTradingDays(Min(First(yyyymmdd), yyyymmdd), yyyymmdd) - 1;
case WEEK:
    period = Floor(day_number / 7);
case MONTH:
    period = Floor(month - First(month));
}
def count = CompoundValue(1, if period != period[1] then (count[1] + period - period[1]) % length else count[1], 0);
def start =  CompoundValue(1, count < count[1] + period - period[1], yes);
def highValue = if start then Highest(high(period = aggregationPeriod), length)[1] else if highValue[1] != 0 then highValue[1] else Double.NaN;
def lowValue = if start then Lowest(low(period = aggregationPeriod), length)[1] else if lowValue[1] != 0 then lowValue[1] else Double.NaN;
def closeValue = if start then close(period = aggregationPeriod)[1] else closeValue[1];
def range = highValue - lowValue;

#PMD Indicator Label on Chart ----------------------------------------------

def na = Double.NaN;
def bn = BarNumber();
def h  = high;
def l  = low;

Script prior {
# subscript for getting prior value of a BarNumber() defined variable
    input prior = close;
    def   priorOf = if prior != prior[1] then prior[1] else priorOf[1];
    plot  priorBar = priorOf;
}
 
   # variables
def cb   = HighestAll(if !IsNaN(h) then bn else na);
def time = GetTime();
def rts  = RegularTradingStart(GetYYYYMMDD());
def rte  = RegularTradingEnd(GetYYYYMMDD());

def RTH = if   time crosses above rts
          then bn else if time <= rts then bn else RTH[1];

def globex = if   time crosses below rte
             then bn else globex[1];

def priorRTH    = prior(RTH);
def priorGlobex = prior(globex);
def hRTH  = HighestAll(RTH);
def hGX   = HighestAll(globex);
def hPRTH = HighestAll(priorRTH);
def hPGX  = HighestAll(priorGlobex);

def gXhigh = HighestAll(if   bn >= hGX && bn < hRTH
                        then h else if hRTH < hGX && bn >= hGX
                                    then h else na);
def gXlow = LowestAll(if   bn >= hGX && bn < hRTH
                      then l else if hRTH < hGX && bn >= hGX
                                  then l else na);

def priorGBXhigh = HighestAll(if   bn >= hPGX
                              &&   bn <  if   hGX < hRTH
                                         then hGX
                                         else hPGX
                              then h else na);
def priorGBXlow = LowestAll(if   bn >= hPGX
                            &&   bn <  if   hGX < hRTH
                                       then hGX
                                       else hPGX
                            then l else na);
 
def displace = -1;
def PDHigh = Highest(high(period = aggregationPeriod)[-displace], length);
def PDLow = Lowest(low(period = aggregationPeriod)[-displace], length);
def PD_Close = close(period = aggregationPeriod)[1];

def tm = SecondsFromTime(00);
Def gxClose = if tm crosses below tm[1] then close[1] else gxClose[1];

def wPMD = if gxclose == PD_Close then 0 else if gXhigh > PDHigh or gXlow < PDLow then 1 else 0;

AddLabel (PMD_Indicator_Label, if wPMD then "w/PMD" else "w/o PMD", if wPMD then Color.GREEN else Color.PINK);


#WITHOUT PM DATA ----------------------------------------------------------

plot R6 = (highValue / lowValue) * closeValue;
plot R5 = (closeValue + range * (1.1) / 2) + 1.168 * ((closeValue + range * (1.1) / 2) – (closeValue + range * (1.1) / 4));
plot R4a = closeValue + range * (1.098) / 2;
plot R4 = closeValue + range * (1.1) / 2;
plot R3 = closeValue + range * (1.1) / 4;
plot R2 = closeValue + range * (1.1) / 6;
plot R1 = closeValue + range * (1.1) / 12;
plot S1 = closeValue - range * (1.1) / 12;
plot S2 = closeValue - range * (1.1) / 6;
plot S3 = closeValue - range * (1.1) / 4;
plot S4 = closeValue - range * (1.1) / 2;
plot S4a = closeValue - range * (1.098) / 2;
plot S5 = (closeValue - range * (1.1) / 2) - 1.168 * ((closeValue - range * (1.1) / 4) - (closeValue - range * (1.1) / 2));
plot S6 = (closeValue - (R6 - closeValue));

def hidewo = ShowCams == ShowCams."w/Only" or (ShowCams == ShowCams."Auto" and wPMD is true);
R6.SetHiding(hidewo);
R5.SetHiding(hide_s5_r5 or hidewo);
R4.SetHiding(hidewo);
R4a.SetHiding(hide_s4a_r4a or hidewo);
R3.SetHiding(hidewo);
R2.SetHiding(hide_s2_r2 or hidewo);
R1.SetHiding(hide_s1_r1 or hidewo);
S1.SetHiding(hide_s1_r1 or hidewo);
S2.SetHiding(hide_s2_r2 or hidewo);
S3.SetHiding(hidewo);
S4.SetHiding(hidewo);
S4a.SetHiding(hidewo);
S5.SetHiding(hide_s5_r5 or hidewo);
S6.SetHiding(hidewo);

R6.SetDefaultColor(Color.RED);
R5.SetDefaultColor(GetColor(7));
R4.SetDefaultColor(Color.GREEN);
R4a.SetDefaultColor(Color.RED);
R3.SetDefaultColor(Color.RED);
R2.SetDefaultColor(GetColor(7));
R1.SetDefaultColor(GetColor(7));
S1.SetDefaultColor(GetColor(7));
S2.SetDefaultColor(GetColor(7));
S3.SetDefaultColor(Color.GREEN);
S4.SetDefaultColor(Color.RED);
S4a.SetDefaultColor(Color.GREEN);
S5.SetDefaultColor(GetColor(7));
S6.SetDefaultColor(Color.GREEN);

def paintingStrategy = if lines == lines.points then PaintingStrategy.POINTS else if lines == lines.triangles then PaintingStrategy.TRIANGLES else if lines == lines.dashes then PaintingStrategy.DASHES else if lines == lines.horizontal then PaintingStrategy.HORIZONTAL else PaintingStrategy.SQUARES;

R6.SetPaintingStrategy(paintingStrategy);
R5.SetPaintingStrategy(paintingStrategy);
R4.SetPaintingStrategy(paintingStrategy);
R4a.SetPaintingStrategy(paintingStrategy);
R3.SetPaintingStrategy(paintingStrategy);
R2.SetPaintingStrategy(paintingStrategy);
R1.SetPaintingStrategy(paintingStrategy);
S1.SetPaintingStrategy(paintingStrategy);
S2.SetPaintingStrategy(paintingStrategy);
S3.SetPaintingStrategy(paintingStrategy);
S4.SetPaintingStrategy(paintingStrategy);
S4a.SetPaintingStrategy(paintingStrategy);
S5.SetPaintingStrategy(paintingStrategy);
S6.SetPaintingStrategy(paintingStrategy);

#Bubbles to describe Pivot Levels w/o Premarket Data --------------------------------------

input bubblemover = -20;
def n = bubblemover;
def n1 = n + 1;

def StartPlot = if ShowBubbles == yes and ((ShowCams == ShowCams."Auto" and !wPMD is true or  aggregationPeriod != aggregationPeriod."DAY") or ShowCams == ShowCams."Both" or ShowCams == ShowCams."w/o Only") then (IsNaN(close[n]) and !IsNaN(close[n1])) else Double.NaN;

AddChartBubble(StartPlot, R6[n1], "R6 " + (if ShowPricesInBubbles then AsText(R6[n1]) else ""), Color.PINK,   if close[n1] > R6[n1] then no else yes);
AddChartBubble(StartPlot and hide_s5_r5 == no, R5[n1], "R5 " + (if ShowPricesInBubbles then AsText(R5[n1]) else ""), Color.GRAY,   if close[n1] > R5[n1] then no else yes);
AddChartBubble(StartPlot, R4[n1], "R4 " + (if ShowPricesInBubbles then AsText(R4[n1]) else ""), Color.ORANGE,   if close[n1] > R4[n1] then no else yes);
AddChartBubble(StartPlot, R3[n1], "R3 " + (if ShowPricesInBubbles then AsText(R3[n1]) else ""), Color.PINK,   if close[n1] > R3[n1] then no else yes);
AddChartBubble(StartPlot and hide_s2_r2 == no, R2[n1], "R2 " + (if ShowPricesInBubbles then AsText(R2[n1]) else ""), Color.GRAY,   if close[n1] > R2[n1] then no else yes);
AddChartBubble(StartPlot and hide_s1_r1 == no, R1[n1], "R1 " + (if ShowPricesInBubbles then AsText(R1[n1]) else ""), Color.GRAY,   if close[n1] > R1[n1] then no else yes);
AddChartBubble(StartPlot, S6[n1], "S6 " + (if ShowPricesInBubbles then AsText(S6[n1]) else ""), Color.LIGHT_GREEN, if close[n1] > S6[n1] then no else yes);
AddChartBubble(StartPlot and hide_s5_r5 == no, S5[n1], "S5 " + (if ShowPricesInBubbles then AsText(S5[n1]) else ""), Color.GRAY, if close[n1] > S5[n1] then no else yes);
AddChartBubble(StartPlot, S4[n1], "S4 " + (if ShowPricesInBubbles then AsText(S4[n1]) else ""), Color.ORANGE, if close[n1] > S4[n1] then no else yes);
AddChartBubble(StartPlot, S3[n1], "S3 " + (if ShowPricesInBubbles then AsText(S3[n1]) else ""), Color.LIGHT_GREEN, if close[n1] > S3[n1] then no else yes);
AddChartBubble(StartPlot and hide_s2_r2 == no, S2[n1], "S2 " + (if ShowPricesInBubbles then AsText(S2[n1]) else ""), Color.GRAY, if close[n1] > S2[n1] then no else yes);
AddChartBubble(StartPlot and hide_s1_r1 == no, S1[n1], "S1 " + (if ShowPricesInBubbles then AsText(S1[n1]) else ""), Color.GRAY, if close[n1] > S1[n1] then no else yes);

R1.HideBubble();
R2.HideBubble();
R3.HideBubble();
R4.HideBubble();
R4a.HideBubble();
R5.HideBubble();
R6.HideBubble();

S1.HideBubble();
S2.HideBubble();
S3.HideBubble();
S4.HideBubble();
S4a.HideBubble();
S5.HideBubble();
S6.HideBubble();

#WITH PREMARKET DATA-------------------------------------------------------

#plot ExtClose = gxClose;
#plot
#PreviousHighGBX = priorGBXhigh;
#PreviousHighGBX.SetDefaultColor(Color.green);
#plot
#PreviousLowGPX  = priorGBXlow;
#PreviousLowGPX.SetDefaultColor(Color.red);
#plot
#gbxClose = gxClose;
#gbxClose.SetDefaultColor(Color.white);
#AddChartBubble(ShowBubbles && bn == cb, priorGBXhigh, "pGBX High", Color.light_green);
#AddChartBubble(ShowBubbles  && bn == cb, priorGBXlow, "pGBX Low", Color.pink,0);
#AddChartBubble(ShowBubbles  && bn == cb, gxClose, "pGBX close", Color.white,0);

#Plotting
def rangew = priorGBXhigh - priorGBXlow;
plot R6w = (priorGBXhigh / priorGBXlow) * gxClose;
plot R5w = (gxClose + rangew * (1.1) / 2) + 1.168 * ((gxClose + rangew * (1.1) / 2) – (gxClose + rangew * (1.1) / 4));
plot R4wa = gxClose + rangew * (1.098) / 2;
plot R4w = gxClose + rangew * (1.1) / 2;
plot R3w = gxClose + rangew * (1.1) / 4;
plot R2w = gxClose + rangew * (1.1) / 6;
plot R1w = gxClose + rangew * (1.1) / 12;
plot S1w = gxClose - rangew * (1.1) / 12;
plot S2w = gxClose - rangew * (1.1) / 6;
plot S3w = gxClose - rangew * (1.1) / 4;
plot S4w = gxClose - rangew * (1.1) / 2;
plot S4wa = gxClose - rangew * (1.098) / 2;
plot S5w = (gxClose - rangew * (1.1) / 2) - 1.168 * ((gxClose - range * (1.1) / 4) - (gxClose - rangew * (1.1) / 2));
plot S6w = (gxClose - (R6w - gxClose));

def hidew = ShowCams == ShowCams."w/o Only" or (ShowCams == ShowCams."Auto" and !wPMD);
R6w.SetHiding(hidew);
R5w.SetHiding(hide_s5_r5 or hidew);
R4w.SetHiding(hidew);
R4wa.SetHiding(hidew);
R3w.SetHiding(hidew);
R2w.SetHiding(hide_s2_r2 or hidew);
R1w.SetHiding(hide_s1_r1 or hidew);
S1w.SetHiding(hide_s1_r1 or hidew);
S2w.SetHiding(hide_s2_r2 or hidew);
S3w.SetHiding(hidew);
S4w.SetHiding(hidew);
S4wa.SetHiding(hide_s4a_r4a or hidew);
S5w.SetHiding(hide_s5_r5 or hidew);
S6w.SetHiding(hidew);

R6w.SetDefaultColor(Color.RED);
R5w.SetDefaultColor(GetColor(7));
R4w.SetDefaultColor(Color.GREEN);
R4wa.SetDefaultColor(Color.RED);
R3w.SetDefaultColor(Color.RED);
R2w.SetDefaultColor(GetColor(7));
R1w.SetDefaultColor(GetColor(7));
S1w.SetDefaultColor(GetColor(7));
S2w.SetDefaultColor(GetColor(7));
S3w.SetDefaultColor(Color.GREEN);
S4w.SetDefaultColor(Color.RED);
S4wa.SetDefaultColor(Color.GREEN);
S5w.SetDefaultColor(GetColor(7));
S6w.SetDefaultColor(Color.GREEN);

R6w.SetPaintingStrategy(paintingStrategy);
R5w.SetPaintingStrategy(paintingStrategy);
R4w.SetPaintingStrategy(paintingStrategy);
R4wa.SetPaintingStrategy(paintingStrategy);
R3w.SetPaintingStrategy(paintingStrategy);
R2w.SetPaintingStrategy(paintingStrategy);
R1w.SetPaintingStrategy(paintingStrategy);
S1w.SetPaintingStrategy(paintingStrategy);
S2w.SetPaintingStrategy(paintingStrategy);
S3w.SetPaintingStrategy(paintingStrategy);
S4w.SetPaintingStrategy(paintingStrategy);
S4wa.SetPaintingStrategy(paintingStrategy);
S5w.SetPaintingStrategy(paintingStrategy);
S6w.SetPaintingStrategy(paintingStrategy);

#Bubbles to describe Pivot Levels w/Premarket Data ------------------------------------

input w_bubblemover = -50;
def n2 = w_bubblemover;
def n3 = n2 + 1;

def StartPlot2 = if ShowBubbles == yes and ((ShowCams == ShowCams."Auto" and wPMD) or ShowCams == ShowCams."Both" or ShowCams == ShowCams."w/Only") then (IsNaN(close[n2]) and !IsNaN(close[n3])) else Double.NaN;

AddChartBubble(StartPlot2, R6w[n3], "R6w " + (if ShowPricesInBubbles then AsText(R6w[n3]) else ""), Color.PINK,   if close[n3] > R6w[n3] then no else yes);
AddChartBubble(StartPlot2 and hide_s5_r5 == no, R5w[n3], "R5w " + (if ShowPricesInBubbles then AsText(R5w[n3]) else ""), Color.GRAY,   if close[n3] > R5w[n3] then no else yes);
AddChartBubble(StartPlot2, R4w[n3], "R4w " + (if ShowPricesInBubbles then AsText(R4w[n3]) else ""), Color.ORANGE,   if close[n3] > R4w[n3] then no else yes);
AddChartBubble(StartPlot2, R3w[n3], "R3w " + (if ShowPricesInBubbles then AsText(R3w[n3]) else ""), Color.PINK,   if close[n3] > R3w[n3] then no else yes);
AddChartBubble(StartPlot2 and hide_s2_r2 == no, R2w[n3], "R2w " + (if ShowPricesInBubbles then AsText(R2w[n3]) else ""), Color.GRAY,   if close[n3] > R2w[n3] then no else yes);
AddChartBubble(StartPlot2 and hide_s1_r1 == no, R1w[n3], "R1w " + (if ShowPricesInBubbles then AsText(R1w[n3]) else ""), Color.GRAY,   if close[n3] > R1w[n3] then no else yes);

AddChartBubble(StartPlot2, S6w[n3], "S6w " + (if ShowPricesInBubbles then AsText(S6w[n3]) else ""), Color.LIGHT_GREEN, if close[n3] > S6w[n3] then no else yes);
AddChartBubble(StartPlot2 and hide_s5_r5 == no, S5w[n3], "S5w " + (if ShowPricesInBubbles then AsText(S5w[n3]) else ""), Color.GRAY, if close[n3] > S5w[n3] then no else yes);
AddChartBubble(StartPlot2, S4w[n3], "S4w " + (if ShowPricesInBubbles then AsText(S4w[n3]) else ""), Color.ORANGE, if close[n3] > S4w[n3] then no else yes);
AddChartBubble(StartPlot2, S3w[n3], "S3w " + (if ShowPricesInBubbles then AsText(S3w[n3]) else ""), Color.LIGHT_GREEN, if close[n3] > S3w[n3] then no else yes);
AddChartBubble(StartPlot2 and hide_s2_r2 == no, S2w[n3], "S2w " + (if ShowPricesInBubbles then AsText(S2w[n3]) else ""), Color.GRAY, if close[n3] > S2w[n3] then no else yes);
AddChartBubble(StartPlot2 and hide_s1_r1 == no, S1w[n3], "S1w " + (if ShowPricesInBubbles then AsText(S1w[n3]) else ""), Color.GRAY, if close[n3] > S1w[n3] then no else yes);

R1w.HideBubble();
R2w.HideBubble();
R3w.HideBubble();
R4w.HideBubble();
R4wa.HideBubble();
R5w.HideBubble();
R6w.HideBubble();

S1w.HideBubble();
S2w.HideBubble();
S3w.HideBubble();
S4w.HideBubble();
S4wa.HideBubble();
S5w.HideBubble();
S6w.HideBubble();

#Floor Pivots Add-on------------------------------------------------------------------
def PH = high(period = aggregationPeriod)[1];
def PL = low(period = aggregationPeriod)[1];
def PC = close(period = aggregationPeriod)[1];
def PP = (PH + PL + PC) / 3.0;
def bc = (PH + PL) / 2.0;
def tc = (PP - bc) + PP;

plot FR4 = PH + (3 * (PP - PL));
plot FR3 = PH + (2 * (PP - PL));
plot CP = PP;
plot FS3 = PL - (2 * (PH - PP));
plot FS4 = PL - (3 * (PH - PP));


FR4.SetHiding(hide_Floor_Pivots);
FR3.SetHiding(hide_Floor_Pivots);
CP.SetHiding(hide_Floor_Pivots);
FS3.SetHiding(hide_Floor_Pivots);
FS4.SetHiding(hide_Floor_Pivots);

FR4.SetDefaultColor(CreateColor(102, 0, 204));
FR3.SetDefaultColor(Color.MAGENTA);
CP.SetDefaultColor(Color.YELLOW);
FS3.SetDefaultColor(Color.MAGENTA);
FS4.SetDefaultColor(CreateColor(102, 0, 204));

FR4.SetPaintingStrategy(paintingStrategy);
FR3.SetPaintingStrategy(paintingStrategy);
CP.SetPaintingStrategy(paintingStrategy);
FS3.SetPaintingStrategy(paintingStrategy);
FS4.SetPaintingStrategy(paintingStrategy);

def StartPlot3 = if ShowBubbles == yes and hide_Floor_Pivots == no then (IsNaN(close[n]) and !IsNaN(close[n1])) else Double.NaN;

AddChartBubble(StartPlot3, CP[n1], "CP " + (if ShowPricesInBubbles then AsText(CP[n1]) else ""), Color.YELLOW,   if close[n1] > CP[n1] then no else yes);
AddChartBubble(StartPlot3, FR4[n1], "FR4 " + (if ShowPricesInBubbles then AsText(FR4[n1]) else ""), (CreateColor(102, 0, 204)), if close[n1] > FR4[n1] then no else yes);
AddChartBubble(StartPlot3, FR3[n1], "FR3 " + (if ShowPricesInBubbles then AsText(FR3[n1]) else ""), Color.MAGENTA,   if close[n1] > FR3[n1] then no else yes);
AddChartBubble(StartPlot3, FS4[n1], "FS4 " + (if ShowPricesInBubbles then AsText(FS4[n1]) else ""), (CreateColor(102, 0, 204)), if close[n1] > FS4[n1] then no else yes);
AddChartBubble(StartPlot3, FS3[n1], "FS3 " + (if ShowPricesInBubbles then AsText(FS3[n1]) else ""), Color.MAGENTA, if close[n1] > FS3[n1] then no else yes);

FR4.HideBubble();
FR3.HideBubble();
CP.HideBubble();
FS3.HideBubble();
FS4.HideBubble();

Scanners and Watchlist Columns:
To change the % of how close to or far from a cam level to scan or have your watchlist column turn green, just change the 'z <= .2 and z >= -.2' to whatever you please. Note that the codes below are based on the built-in ToS cam study, to scan mine instead just change the 'CamarillaPoints' in the codes to whatever you named my study.

Scanners:
Near Daily cam levels.
Near Monthly cam levels

Watchlist Columns:
Rather than posting 8 watchlist columns, I'm going to share an example of each. Just change all 4 places in the code to other cam levels like R4 or whatnot.

Daily S4:
Code:
def s4 = CamarillaPoints(length = 1).s4 ;
def diff = close - s4 ;
def diff_per = round(100 * diff/s4, 1);

plot z = diff_per;
assignBackgroundColor(if z <= .2 and z >= -.2 then color.dark_green else color.dark_red)

Montly S4:
Code:
def s4 = CamarillaPoints("aggregation period" = "MONTH", "length" = 1).s4 ;
def diff = close - s4 ;
def diff_per = round(100 * diff/s4, 1);

plot z = diff_per;
assignBackgroundColor(if z <= 1 and z >= -1 then color.dark_green else color.dark_red);

oXANzuh.png
Hi Wiinii,

Can you help me understand the different cam levels you created? I am on chapter 3 in the book, so it's possible I haven't gotten far enough to understand. I understand the "normal" cam levels (e.g., S6-R6), but I don't know where the additional levels are from. Are these based on the traditional floor pivots Thor discusses in his book?

If there is a resource that explains, please let me know. It's possible I missed it or haven't seen yet.

Thanks,
saint2022
 
There are the standard cams, cams with premarket data (like R4w), and floor pivots central/3/4 (yellow/pink/purple).
Hi, Wiinii

Thank you for writing this awesome script. Can I ask for the Cam pivots using pre-market data, are you using pre-market high, pre-market low and previous day closing value for the Cam formulas ?

Many Thanks
Ap0c
 
Hi, Wiinii

Thank you for writing this awesome script. Can I ask for the Cam pivots using pre-market data, are you using pre-market high, pre-market low and previous day closing value for the Cam formulas ?

Many Thanks
Ap0c
They wouldn't be right otherwise, so of course.
 
Hello Wiinii, could you please indicate what the following abbreviations mean?

FR3
FR4
FS3
FS4
R4WA
S4WA
R4A
S4A
S3W

Cheers
 
Hi Wiinii, I love love this script! Is there a way to only show the current day's levels? Thank you
 
Wow this is incredible stuff, I'm new to thinkscript and experimenting after reading Thor's book. Just wanted to say thank you so much for sharing this! Really fantastic stuff.
 
For anyone interested I went into more detail on the differences here. Thor himself explained the differences in platforms in his mentorship and recommends mine to ToS users regularly.

But I would also just say that I wouldn't recommend anyone use ToS alone for his strategy because it relies so highly on full Level 2 and proper hotkeys.
The thread explaining the differences seems to have a bad link, is there a good link where I can find it?
 
I'm getting two sets of cams when trying to use this study for futures, is there a setting I can change or does it not work with the futures?
 

Attachments

  • Screenshot (1).png
    Screenshot (1).png
    266.6 KB · Views: 189
I'm getting two sets of cams when trying to use this study for futures, is there a setting I can change or does it not work with the futures?
Those might be the two sets of levels..one "with" and another "without" Premarket data factored. I use them both, as I've seen both of those levels being respected by the stock on the same day.. Have seen this behavior over and over again on multiple stocks - both coming into play on "same" day!

I dont trade futures, but I do believe Futures do respect Cam levels...here's a link concerning Ironbeam futures trading and Cam level discussion , that showed up on a quick search

https://www.ironbeam.com/community/t/daily-camarilla-pivot-points-are-needed/195

BTW - these are "standard" Camarilla pivot points - standard formula employed on different platforms.
 
This is a complete trading strategy indicator built around Thor Young's book A Complete Day Trading System.

It includes:
  • Camarilla Pivot Points - Both with and without premarket data.
  • Label on chart showing whether to use cams with or without PMD. See animated gif.
  • Auto option shows only the cams needed based on the above! Optionally show both cams with and without PMD at all times, or only one or the other. NOTE: You need at least 2 days data on your charts for w/PMD cams (3 on 3-day holiday weekends).
  • Floor Pivots 3, 4, and Central. (Can be toggled on and off). They are labeled as FS4, FS3, FR4 and FR3.
  • Option to hide cam levels 1, 2 and 5 (hidden by default).
  • Options for Daily, Weekly, and Monthly. Yes, you can see the monthly cams on your intraday chart!
  • S/R4a and S/R4wa are optional, but it allows the dual colors for those levels which you'll see by default. I recommend making the green S4 lines slightly thicker than the red (ex. red 1 green 2) for it to look best.
  • IMPORTANT NOTE: Because Thor relies heavily on DAS, I want to clarify that DAS cams for futures are WRONG! They are not calculated from 1800 open to 1700 close which is how cams are properly calculated for futures and calculated by default in ToS. Also ETFs (SPY and QQQ) trade for much longer than DAS calculates, which is why the w/PMD cams for them won't match either, because theirs too are wrong. Which means these are more accurate (since they calculate using the correct timeframe and use all the data). More info. This is also why the VWAP won't be in the same place for futures on DAS and ToS either.
UPDATE: 1.5 - 4/7/23
  • Bubbles now have the option to be placed in the expansion area or at a specified time (don't use time on the daily chart of course). To see it in the expansion area, click on the gear above the chart > go to Time Axis and change the Expansion area to a number that keeps them off your charts (this will vary depending on timeframe and zoom level).
Shared Link: http://tos.mx/XiBac3J (or use code below). Click here for --> Easiest way to load shared links

To complement this, I've also created the Reversal Candle Anomaly Detector w/Volume-Colored VPA Candles!

Scanners and Watchlist Columns are at the bottom of this post!


Other indicators I also use/recommend:

View attachment 16142

View attachment 16143

Code:
# Thor's Camarilla Pivot Points
# Wiinii
# v1.5
# Based on Thor's book 'A Complete Day Trading System' to include R5 & S5, levels colored accordingly, CAMS with pre-market data, Central Pivot + Floor Pivots 3&4, and label to easily tell you if you should use With or W/O Premarket Data and option only to show the cams based on that!
# Some code based on code by SleepyZ & Nube
# https://usethinkscript.com/threads/pivot-day-trading-system-for-thinkorswim.12988/

declare once_per_bar;

input aggregationPeriod = {default "DAY", "WEEK", "MONTH"};
input length = 1;
input ShowBubbles = yes;
input ShowPricesInBubbles = yes;
input locate_bubbles_at = {default Expansion, Time};
input locate_bubbles_at_time = 600;
input BarsFromExpansion = 1;
input PMD_Indicator_Label = yes;
input ShowCams = {default "Auto", "w/o Only", "Both", "w/Only"};
input hide_Floor_Pivots = no;
input hide_s4a_r4a = no;
input hide_s1_r1 = yes;
input hide_s2_r2 = yes;
input hide_s5_r5 = yes;
input lines = {default horizontal, dashes, points, triangles, squares};
input HasNoGlobeX = no;

Assert(length > 0, "'length' should be positive: " + length);

def timeopen = SecondsFromTime(locate_bubbles_at_time) == 0;
def isExpansion = locate_bubbles_at == locate_bubbles_at.Expansion and IsNaN(close);
def firstExpansionBar = if !IsNaN(close[-1]) and isExpansion then 1 else if isExpansion then firstExpansionBar[1] + 1 else 0;
def BubbleLocation = if locate_bubbles_at == locate_bubbles_at.Time then timeopen else isExpansion and firstExpansionBar == BarsFromExpansion;

def yyyymmdd = GetYYYYMMDD();
def month = GetYear() * 12 + GetMonth();
def day_number = DaysFromDate(First(yyyymmdd)) + GetDayOfWeek(First(yyyymmdd));
def period;
switch (aggregationPeriod) {
case DAY:
    period = CountTradingDays(Min(First(yyyymmdd), yyyymmdd), yyyymmdd) - 1;
case WEEK:
    period = Floor(day_number / 7);
case MONTH:
    period = Floor(month - First(month));
}
def count = CompoundValue(1, if period != period[1] then (count[1] + period - period[1]) % length else count[1], 0);
def start =  CompoundValue(1, count < count[1] + period - period[1], yes);
def highValue = if start then Highest(high(period = aggregationPeriod), length)[1] else if highValue[1] != 0 then highValue[1] else Double.NaN;
def lowValue = if start then Lowest(low(period = aggregationPeriod), length)[1] else if lowValue[1] != 0 then lowValue[1] else Double.NaN;
def closeValue = if start then close(period = aggregationPeriod)[1] else closeValue[1];
def range = highValue - lowValue;

#PMD Indicator Label on Chart ----------------------------------------------

def na = Double.NaN;
def bn = BarNumber();
def h  = high;
def l  = low;

Script prior {
# subscript for getting prior value of a BarNumber() defined variable
    input prior = close;
    def   priorOf = if prior != prior[1] then prior[1] else priorOf[1];
    plot  priorBar = priorOf;
}
 
   # variables
def cb   = HighestAll(if !IsNaN(h) then bn else na);
def time = GetTime();
def rts  = RegularTradingStart(GetYYYYMMDD());
def rte  = RegularTradingEnd(GetYYYYMMDD());

def RTH = if   time crosses above rts
          then bn else if time <= rts then bn else RTH[1];

def globex = if   time crosses below rte
             then bn else globex[1];

def priorRTH    = prior(RTH);
def priorGlobex = prior(globex);
def hRTH  = HighestAll(RTH);
def hGX   = HighestAll(globex);
def hPRTH = HighestAll(priorRTH);
def hPGX  = HighestAll(priorGlobex);

def gXhigh = HighestAll(if   bn >= hGX && bn < hRTH
                        then h else if hRTH < hGX && bn >= hGX
                                    then h else na);
def gXlow = LowestAll(if   bn >= hGX && bn < hRTH
                      then l else if hRTH < hGX && bn >= hGX
                                  then l else na);

def priorGBXhigh = HighestAll(if   bn >= hPGX
                              &&   bn <  if   hGX < hRTH
                                         then hGX
                                         else hPGX
                              then h else na);
def priorGBXlow = LowestAll(if   bn >= hPGX
                            &&   bn <  if   hGX < hRTH
                                       then hGX
                                       else hPGX
                            then l else na);
 
def displace = -1;
def PDHigh = Highest(high(period = aggregationPeriod)[-displace], length);
def PDLow = Lowest(low(period = aggregationPeriod)[-displace], length);
def PD_Close = close(period = aggregationPeriod)[1];

def tm = SecondsFromTime(00);
Def gxClose = if tm crosses below tm[1] then close[1] else gxClose[1];

def wPMD = if (HasNoGlobeX and gxclose == PD_Close) then 0 else if gXhigh > PDHigh or gXlow < PDLow then 1 else 0;

AddLabel (PMD_Indicator_Label, if wPMD then "w/PMD" else "w/o PMD", if wPMD then Color.GREEN else Color.PINK);


#WITHOUT PM DATA ----------------------------------------------------------

plot R6 = (highValue / lowValue) * closeValue;
plot R5 = (closeValue + range * (1.1) / 2) + 1.168 * ((closeValue + range * (1.1) / 2) – (closeValue + range * (1.1) / 4));
plot R4a = closeValue + range * (1.098) / 2;
plot R4 = closeValue + range * (1.1) / 2;
plot R3 = closeValue + range * (1.1) / 4;
plot R2 = closeValue + range * (1.1) / 6;
plot R1 = closeValue + range * (1.1) / 12;
plot S1 = closeValue - range * (1.1) / 12;
plot S2 = closeValue - range * (1.1) / 6;
plot S3 = closeValue - range * (1.1) / 4;
plot S4 = closeValue - range * (1.1) / 2;
plot S4a = closeValue - range * (1.098) / 2;
plot S5 = (closeValue - range * (1.1) / 2) - 1.168 * ((closeValue - range * (1.1) / 4) - (closeValue - range * (1.1) / 2));
plot S6 = (closeValue - (R6 - closeValue));

def hidewo = ShowCams == ShowCams."w/Only" or (ShowCams == ShowCams."Auto" and wPMD is true);
R6.SetHiding(hidewo);
R5.SetHiding(hide_s5_r5 or hidewo);
R4.SetHiding(hidewo);
R4a.SetHiding(hide_s4a_r4a or hidewo);
R3.SetHiding(hidewo);
R2.SetHiding(hide_s2_r2 or hidewo);
R1.SetHiding(hide_s1_r1 or hidewo);
S1.SetHiding(hide_s1_r1 or hidewo);
S2.SetHiding(hide_s2_r2 or hidewo);
S3.SetHiding(hidewo);
S4.SetHiding(hidewo);
S4a.SetHiding(hidewo);
S5.SetHiding(hide_s5_r5 or hidewo);
S6.SetHiding(hidewo);

R6.SetDefaultColor(Color.RED);
R5.SetDefaultColor(GetColor(7));
R4.SetDefaultColor(Color.GREEN);
R4a.SetDefaultColor(Color.RED);
R3.SetDefaultColor(Color.RED);
R2.SetDefaultColor(GetColor(7));
R1.SetDefaultColor(GetColor(7));
S1.SetDefaultColor(GetColor(7));
S2.SetDefaultColor(GetColor(7));
S3.SetDefaultColor(Color.GREEN);
S4.SetDefaultColor(Color.RED);
S4a.SetDefaultColor(Color.GREEN);
S5.SetDefaultColor(GetColor(7));
S6.SetDefaultColor(Color.GREEN);

def paintingStrategy = if lines == lines.points then PaintingStrategy.POINTS else if lines == lines.triangles then PaintingStrategy.TRIANGLES else if lines == lines.dashes then PaintingStrategy.DASHES else if lines == lines.horizontal then PaintingStrategy.HORIZONTAL else PaintingStrategy.SQUARES;

R6.SetPaintingStrategy(paintingStrategy);
R5.SetPaintingStrategy(paintingStrategy);
R4.SetPaintingStrategy(paintingStrategy);
R4a.SetPaintingStrategy(paintingStrategy);
R3.SetPaintingStrategy(paintingStrategy);
R2.SetPaintingStrategy(paintingStrategy);
R1.SetPaintingStrategy(paintingStrategy);
S1.SetPaintingStrategy(paintingStrategy);
S2.SetPaintingStrategy(paintingStrategy);
S3.SetPaintingStrategy(paintingStrategy);
S4.SetPaintingStrategy(paintingStrategy);
S4a.SetPaintingStrategy(paintingStrategy);
S5.SetPaintingStrategy(paintingStrategy);
S6.SetPaintingStrategy(paintingStrategy);

#Bubbles to describe Pivot Levels w/o Premarket Data --------------------------------------


def StartPlot = if ShowBubbles == yes and ((ShowCams == ShowCams."Auto" and !wPMD is true or  aggregationPeriod != aggregationPeriod."DAY") or ShowCams == ShowCams."Both" or ShowCams == ShowCams."w/o Only") then BubbleLocation else Double.NaN;

AddChartBubble(StartPlot, R6, "R6 " + (if ShowPricesInBubbles then AsText(R6) else ""), Color.PINK,   if close > R6 then no else yes);
AddChartBubble(StartPlot and hide_s5_r5 == no, R5, "R5 " + (if ShowPricesInBubbles then AsText(R5) else ""), Color.GRAY,   if close > R5 then no else yes);
AddChartBubble(StartPlot, R4, "R4 " + (if ShowPricesInBubbles then AsText(R4) else ""), Color.ORANGE,   if close > R4 then no else yes);
AddChartBubble(StartPlot, R3, "R3 " + (if ShowPricesInBubbles then AsText(R3) else ""), Color.PINK,   if close > R3 then no else yes);
AddChartBubble(StartPlot and hide_s2_r2 == no, R2, "R2 " + (if ShowPricesInBubbles then AsText(R2) else ""), Color.GRAY,   if close > R2 then no else yes);
AddChartBubble(StartPlot and hide_s1_r1 == no, R1, "R1 " + (if ShowPricesInBubbles then AsText(R1) else ""), Color.GRAY,   if close > R1 then no else yes);
AddChartBubble(StartPlot, S6, "S6 " + (if ShowPricesInBubbles then AsText(S6) else ""), Color.LIGHT_GREEN, if close > S6 then no else yes);
AddChartBubble(StartPlot and hide_s5_r5 == no, S5, "S5 " + (if ShowPricesInBubbles then AsText(S5) else ""), Color.GRAY, if close > S5 then no else yes);
AddChartBubble(StartPlot, S4, "S4 " + (if ShowPricesInBubbles then AsText(S4) else ""), Color.ORANGE, if close > S4 then no else yes);
AddChartBubble(StartPlot, S3, "S3 " + (if ShowPricesInBubbles then AsText(S3) else ""), Color.LIGHT_GREEN, if close > S3 then no else yes);
AddChartBubble(StartPlot and hide_s2_r2 == no, S2, "S2 " + (if ShowPricesInBubbles then AsText(S2) else ""), Color.GRAY, if close > S2 then no else yes);
AddChartBubble(StartPlot and hide_s1_r1 == no, S1, "S1 " + (if ShowPricesInBubbles then AsText(S1) else ""), Color.GRAY, if close > S1 then no else yes);

R1.HideBubble();
R2.HideBubble();
R3.HideBubble();
R4.HideBubble();
R4a.HideBubble();
R5.HideBubble();
R6.HideBubble();

S1.HideBubble();
S2.HideBubble();
S3.HideBubble();
S4.HideBubble();
S4a.HideBubble();
S5.HideBubble();
S6.HideBubble();

R1.HideTitle();
R2.HideTitle();
R3.HideTitle();
R4.HideTitle();
R4a.HideTitle();
R5.HideTitle();
R6.HideTitle();

S1.HideTitle();
S2.HideTitle();
S3.HideTitle();
S4.HideTitle();
S4a.HideTitle();
S5.HideTitle();
S6.HideTitle();

#WITH PREMARKET DATA-------------------------------------------------------

#plot ExtClose = gxClose;
#plot
#PreviousHighGBX = priorGBXhigh;
#PreviousHighGBX.SetDefaultColor(Color.green);
#plot
#PreviousLowGPX  = priorGBXlow;
#PreviousLowGPX.SetDefaultColor(Color.red);
#plot
#gbxClose = gxClose;
#gbxClose.SetDefaultColor(Color.white);
#AddChartBubble(ShowBubbles && bn == cb, priorGBXhigh, "pGBX High", Color.light_green);
#AddChartBubble(ShowBubbles  && bn == cb, priorGBXlow, "pGBX Low", Color.pink,0);
#AddChartBubble(ShowBubbles  && bn == cb, gxClose, "pGBX close", Color.white,0);

#Plotting
def rangew = priorGBXhigh - priorGBXlow;
plot R6w = (priorGBXhigh / priorGBXlow) * gxClose;
plot R5w = (gxClose + rangew * (1.1) / 2) + 1.168 * ((gxClose + rangew * (1.1) / 2) – (gxClose + rangew * (1.1) / 4));
plot R4wa = gxClose + rangew * (1.098) / 2;
plot R4w = gxClose + rangew * (1.1) / 2;
plot R3w = gxClose + rangew * (1.1) / 4;
plot R2w = gxClose + rangew * (1.1) / 6;
plot R1w = gxClose + rangew * (1.1) / 12;
plot S1w = gxClose - rangew * (1.1) / 12;
plot S2w = gxClose - rangew * (1.1) / 6;
plot S3w = gxClose - rangew * (1.1) / 4;
plot S4w = gxClose - rangew * (1.1) / 2;
plot S4wa = gxClose - rangew * (1.098) / 2;
plot S5w = (gxClose - rangew * (1.1) / 2) - 1.168 * ((gxClose - range * (1.1) / 4) - (gxClose - rangew * (1.1) / 2));
plot S6w = (gxClose - (R6w - gxClose));

def hidew = ShowCams == ShowCams."w/o Only" or (ShowCams == ShowCams."Auto" and !wPMD);
R6w.SetHiding(hidew);
R5w.SetHiding(hide_s5_r5 or hidew);
R4w.SetHiding(hidew);
R4wa.SetHiding(hidew);
R3w.SetHiding(hidew);
R2w.SetHiding(hide_s2_r2 or hidew);
R1w.SetHiding(hide_s1_r1 or hidew);
S1w.SetHiding(hide_s1_r1 or hidew);
S2w.SetHiding(hide_s2_r2 or hidew);
S3w.SetHiding(hidew);
S4w.SetHiding(hidew);
S4wa.SetHiding(hide_s4a_r4a or hidew);
S5w.SetHiding(hide_s5_r5 or hidew);
S6w.SetHiding(hidew);

R6w.SetDefaultColor(Color.RED);
R5w.SetDefaultColor(GetColor(7));
R4w.SetDefaultColor(Color.GREEN);
R4wa.SetDefaultColor(Color.RED);
R3w.SetDefaultColor(Color.RED);
R2w.SetDefaultColor(GetColor(7));
R1w.SetDefaultColor(GetColor(7));
S1w.SetDefaultColor(GetColor(7));
S2w.SetDefaultColor(GetColor(7));
S3w.SetDefaultColor(Color.GREEN);
S4w.SetDefaultColor(Color.RED);
S4wa.SetDefaultColor(Color.GREEN);
S5w.SetDefaultColor(GetColor(7));
S6w.SetDefaultColor(Color.GREEN);

R6w.SetPaintingStrategy(paintingStrategy);
R5w.SetPaintingStrategy(paintingStrategy);
R4w.SetPaintingStrategy(paintingStrategy);
R4wa.SetPaintingStrategy(paintingStrategy);
R3w.SetPaintingStrategy(paintingStrategy);
R2w.SetPaintingStrategy(paintingStrategy);
R1w.SetPaintingStrategy(paintingStrategy);
S1w.SetPaintingStrategy(paintingStrategy);
S2w.SetPaintingStrategy(paintingStrategy);
S3w.SetPaintingStrategy(paintingStrategy);
S4w.SetPaintingStrategy(paintingStrategy);
S4wa.SetPaintingStrategy(paintingStrategy);
S5w.SetPaintingStrategy(paintingStrategy);
S6w.SetPaintingStrategy(paintingStrategy);

#Bubbles to describe Pivot Levels w/Premarket Data ------------------------------------


def StartPlot2 = if ShowBubbles == yes and ((ShowCams == ShowCams."Auto" and wPMD) or ShowCams == ShowCams."Both" or ShowCams == ShowCams."w/Only") then BubbleLocation else Double.NaN;

AddChartBubble(StartPlot2, R6w, "R6w " + (if ShowPricesInBubbles then AsText(R6w) else ""), Color.PINK,   if close > R6w then no else yes);
AddChartBubble(StartPlot2 and hide_s5_r5 == no, R5w, "R5w " + (if ShowPricesInBubbles then AsText(R5w) else ""), Color.GRAY,   if close > R5w then no else yes);
AddChartBubble(StartPlot2, R4w, "R4w " + (if ShowPricesInBubbles then AsText(R4w) else ""), Color.ORANGE,   if close > R4w then no else yes);
AddChartBubble(StartPlot2, R3w, "R3w " + (if ShowPricesInBubbles then AsText(R3w) else ""), Color.PINK,   if close > R3w then no else yes);
AddChartBubble(StartPlot2 and hide_s2_r2 == no, R2w, "R2w " + (if ShowPricesInBubbles then AsText(R2w) else ""), Color.GRAY,   if close > R2w then no else yes);
AddChartBubble(StartPlot2 and hide_s1_r1 == no, R1w, "R1w " + (if ShowPricesInBubbles then AsText(R1w) else ""), Color.GRAY,   if close > R1w then no else yes);

AddChartBubble(StartPlot2, S6w, "S6w " + (if ShowPricesInBubbles then AsText(S6w) else ""), Color.LIGHT_GREEN, if close > S6w then no else yes);
AddChartBubble(StartPlot2 and hide_s5_r5 == no, S5w, "S5w " + (if ShowPricesInBubbles then AsText(S5w) else ""), Color.GRAY, if close > S5w then no else yes);
AddChartBubble(StartPlot2, S4w, "S4w " + (if ShowPricesInBubbles then AsText(S4w) else ""), Color.ORANGE, if close > S4w then no else yes);
AddChartBubble(StartPlot2, S3w, "S3w " + (if ShowPricesInBubbles then AsText(S3w) else ""), Color.LIGHT_GREEN, if close > S3w then no else yes);
AddChartBubble(StartPlot2 and hide_s2_r2 == no, S2w, "S2w " + (if ShowPricesInBubbles then AsText(S2w) else ""), Color.GRAY, if close > S2w then no else yes);
AddChartBubble(StartPlot2 and hide_s1_r1 == no, S1w, "S1w " + (if ShowPricesInBubbles then AsText(S1w) else ""), Color.GRAY, if close > S1w then no else yes);

R1w.HideBubble();
R2w.HideBubble();
R3w.HideBubble();
R4w.HideBubble();
R4wa.HideBubble();
R5w.HideBubble();
R6w.HideBubble();

S1w.HideBubble();
S2w.HideBubble();
S3w.HideBubble();
S4w.HideBubble();
S4wa.HideBubble();
S5w.HideBubble();
S6w.HideBubble();

R1w.HideTitle();
R2w.HideTitle();
R3w.HideTitle();
R4w.HideTitle();
R4wa.HideTitle();
R5w.HideTitle();
R6w.HideTitle();

S1w.HideTitle();
S2w.HideTitle();
S3w.HideTitle();
S4w.HideTitle();
S4wa.HideTitle();
S5w.HideTitle();
S6w.HideTitle();

#Floor Pivots Add-on------------------------------------------------------------------
def PH = high(period = aggregationPeriod)[1];
def PL = low(period = aggregationPeriod)[1];
def PC = close(period = aggregationPeriod)[1];
def PP = (PH + PL + PC) / 3.0;
def bc = (PH + PL) / 2.0;
def tc = (PP - bc) + PP;

plot FR4 = PH + (3 * (PP - PL));
plot FR3 = PH + (2 * (PP - PL));
plot CP = PP;
plot FS3 = PL - (2 * (PH - PP));
plot FS4 = PL - (3 * (PH - PP));


FR4.SetHiding(hide_Floor_Pivots);
FR3.SetHiding(hide_Floor_Pivots);
CP.SetHiding(hide_Floor_Pivots);
FS3.SetHiding(hide_Floor_Pivots);
FS4.SetHiding(hide_Floor_Pivots);

FR4.SetDefaultColor(CreateColor(102, 0, 204));
FR3.SetDefaultColor(Color.MAGENTA);
CP.SetDefaultColor(Color.YELLOW);
FS3.SetDefaultColor(Color.MAGENTA);
FS4.SetDefaultColor(CreateColor(102, 0, 204));

FR4.SetPaintingStrategy(paintingStrategy);
FR3.SetPaintingStrategy(paintingStrategy);
CP.SetPaintingStrategy(paintingStrategy);
FS3.SetPaintingStrategy(paintingStrategy);
FS4.SetPaintingStrategy(paintingStrategy);

def StartPlot3 = if ShowBubbles == yes and hide_Floor_Pivots == no then BubbleLocation else Double.NaN;

AddChartBubble(StartPlot3, CP, "CP " + (if ShowPricesInBubbles then AsText(CP) else ""), Color.YELLOW,   if close > CP then no else yes);
AddChartBubble(StartPlot3, FR4, "FR4 " + (if ShowPricesInBubbles then AsText(FR4) else ""), (CreateColor(102, 0, 204)), if close > FR4 then no else yes);
AddChartBubble(StartPlot3, FR3, "FR3 " + (if ShowPricesInBubbles then AsText(FR3) else ""), Color.MAGENTA,   if close > FR3 then no else yes);
AddChartBubble(StartPlot3, FS4, "FS4 " + (if ShowPricesInBubbles then AsText(FS4) else ""), (CreateColor(102, 0, 204)), if close > FS4 then no else yes);
AddChartBubble(StartPlot3, FS3, "FS3 " + (if ShowPricesInBubbles then AsText(FS3) else ""), Color.MAGENTA, if close > FS3 then no else yes);

FR4.HideBubble();
FR3.HideBubble();
CP.HideBubble();
FS3.HideBubble();
FS4.HideBubble();

FR4.HideTitle();
FR3.HideTitle();
CP.HideTitle();
FS3.HideTitle();
FS4.HideTitle();

Scanners and Watchlist Columns:
To change the % of how close to or far from a cam level to scan or have your watchlist column turn green, just change the 'z <= .2 and z >= -.2' to whatever you please. Note that the codes below are based on the built-in ToS cam study, to scan mine instead just change the 'CamarillaPoints' in the codes to whatever you named my study.

Scanners:
Near Daily cam levels.
Near Monthly cam levels

Watchlist Columns:
Rather than posting 8 watchlist columns, I'm going to share an example of each. Just change all 4 places in the code to other cam levels like R4 or whatnot.

Daily S4:
Code:
def s4 = CamarillaPoints(length = 1).s4 ;
def diff = close - s4 ;
def diff_per = round(100 * diff/s4, 1);

plot z = diff_per;
assignBackgroundColor(if z <= .2 and z >= -.2 then color.dark_green else color.dark_red)

Montly S4:
Code:
def s4 = CamarillaPoints("aggregation period" = "MONTH", "length" = 1).s4 ;
def diff = close - s4 ;
def diff_per = round(100 * diff/s4, 1);

plot z = diff_per;
assignBackgroundColor(if z <= 1 and z >= -1 then color.dark_green else color.dark_red);


View attachment 16144
Thanks so much for this awesome study. I'm a BBT member and have always had trouble following
Thor's pivots. Now I can finally go more in depth into his book, which I also have.
 
Thanks so much for this awesome study. I'm a BBT member and have always had trouble following
Thor's pivots. Now I can finally go more in depth into his book, which I also have.
I'm not part of any community..but these are standard Camarilla pivot points, not unique!
BTW, have you read Frank Ochoa,aka PivotBoss's book published several years ago?
 
Last edited:
I've clarified that in the original post, but it's the classic floor pivots.
Thank you so much for this. It's brilliant. I'm really looking forward to using this. When I add it to much charts I get two yellow Central Point lines. I've pasted the script without modifications. Any idea why this might happen?ff
 

Attachments

  • Screenshot 2024-02-28 at 8.07.46 PM.png
    Screenshot 2024-02-28 at 8.07.46 PM.png
    211 KB · Views: 41

Join useThinkScript to post your question to a community of 21,000+ developers and traders.

Similar threads

Not the exact question you're looking for?

Start a new thread and receive assistance from our community.

87k+ Posts
493 Online
Create Post

Similar threads

Similar threads

The Market Trading Game Changer

Join 2,500+ subscribers inside the useThinkScript VIP Membership Club
  • Exclusive indicators
  • Proven strategies & setups
  • Private Discord community
  • ‘Buy The Dip’ signal alerts
  • Exclusive members-only content
  • Add-ons and resources
  • 1 full year of unlimited support

Frequently Asked Questions

What is useThinkScript?

useThinkScript is the #1 community of stock market investors using indicators and other tools to power their trading strategies. Traders of all skill levels use our forums to learn about scripting and indicators, help each other, and discover new ways to gain an edge in the markets.

How do I get started?

We get it. Our forum can be intimidating, if not overwhelming. With thousands of topics, tens of thousands of posts, our community has created an incredibly deep knowledge base for stock traders. No one can ever exhaust every resource provided on our site.

If you are new, or just looking for guidance, here are some helpful links to get you started.

What are the benefits of VIP Membership?
VIP members get exclusive access to these proven and tested premium indicators: Buy the Dip, Advanced Market Moves 2.0, Take Profit, and Volatility Trading Range. In addition, VIP members get access to over 50 VIP-only custom indicators, add-ons, and strategies, private VIP-only forums, private Discord channel to discuss trades and strategies in real-time, customer support, trade alerts, and much more. Learn all about VIP membership here.
How can I access the premium indicators?
To access the premium indicators, which are plug and play ready, sign up for VIP membership here.
Back
Top