I was trying to use chat GPT to calculate this indicator and write the script however I cannot get the math correctly, The bubbles to separate clearly, or the lines drawn from the candle to the right.
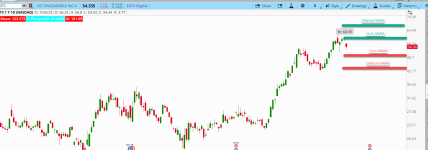
I want a think or swim TOS indicator to calculate the MMM number (Market Maker Move Number) x2, add it to the stock price and put a line above the stock price’s Current day candle only extending to the right to the price column of the chart. Use GetMarketMakerMove() to access the MMM Number. Then I want to take the MMM number (Market Maker Move Number) x2 and subtract it from the stock price and place a horizontal line below the stock price.
Also Create a manual entry to draw another line using the manually entered price. The same way.
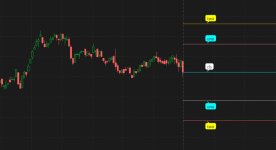
The manual entry line is to take that entered price add it to the current stock price and place a line above the candle. Also take the manually entered price and subtract it from the current stock price and place a line below the candle. I want the four lines of calculations (The MMM calculations and manual calculations to extend to the right all the way to the price column of the chart. Also add a price above each line.
Also, I want to be able to click on the bubble to pull up the Edit studies box to change the price. Unless I would be able to change the manual price in the bubble. The manual entry would be the option projected move. This would be for evaluating an iron Condor on the chart.
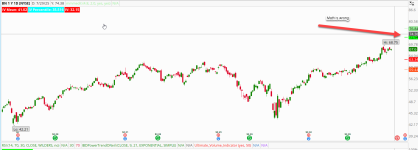
The current problem is the math is not calculating correctly.
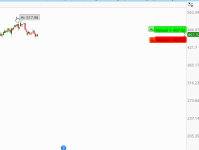
One of the photos is what I am trying to create and the other photo is what I keep getting. There is another photo which just hashes to the right at the price which would at least be acceptable but the math is completely wrong by like $10.
Thank you in advance for any assistance you can give me.
I want a think or swim TOS indicator to calculate the MMM number (Market Maker Move Number) x2, add it to the stock price and put a line above the stock price’s Current day candle only extending to the right to the price column of the chart. Use GetMarketMakerMove() to access the MMM Number. Then I want to take the MMM number (Market Maker Move Number) x2 and subtract it from the stock price and place a horizontal line below the stock price.
Also Create a manual entry to draw another line using the manually entered price. The same way.
The manual entry line is to take that entered price add it to the current stock price and place a line above the candle. Also take the manually entered price and subtract it from the current stock price and place a line below the candle. I want the four lines of calculations (The MMM calculations and manual calculations to extend to the right all the way to the price column of the chart. Also add a price above each line.
Also, I want to be able to click on the bubble to pull up the Edit studies box to change the price. Unless I would be able to change the manual price in the bubble. The manual entry would be the option projected move. This would be for evaluating an iron Condor on the chart.
The current problem is the math is not calculating correctly.
One of the photos is what I am trying to create and the other photo is what I keep getting. There is another photo which just hashes to the right at the price which would at least be acceptable but the math is completely wrong by like $10.
Thank you in advance for any assistance you can give me.