Hi,
Came across this really cool study from @Svanoy https://usethinkscript.com/threads/...volume-rvol-for-thinkorswim.16051/post-130478
And wanted to ask if there was a way to provide the code needed to sum up and derive the average volume over either 10 or 15 bars and use that as a trigger point for the remainder of the session.
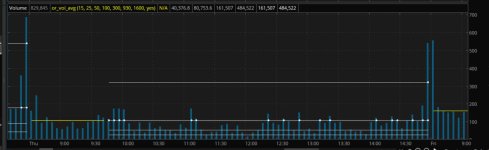
In this case, looking at this chart, I'd like to sum up the average of the first 10 or 15 bars from the cash open and then carry that number forward to signal when a single bar exceeds that average.

Example here would to be sum up the total volume from these 1m volume bars that span 15m from 9:30am (open) and then set triggers when volume bars exceed that avg volume summed up from the first 15m bars combined. The next step would be to set triggers for 25% 50% , 100% and 300% above the number derived from the first 15 volume bars.
H
Came across this really cool study from @Svanoy https://usethinkscript.com/threads/...volume-rvol-for-thinkorswim.16051/post-130478
And wanted to ask if there was a way to provide the code needed to sum up and derive the average volume over either 10 or 15 bars and use that as a trigger point for the remainder of the session.
In this case, looking at this chart, I'd like to sum up the average of the first 10 or 15 bars from the cash open and then carry that number forward to signal when a single bar exceeds that average.
Example here would to be sum up the total volume from these 1m volume bars that span 15m from 9:30am (open) and then set triggers when volume bars exceed that avg volume summed up from the first 15m bars combined. The next step would be to set triggers for 25% 50% , 100% and 300% above the number derived from the first 15 volume bars.
H
Last edited: