The "Bullish Reversal Patterns Scanner" is a ThinkScript designed to identify seven common bullish reversal candlestick patterns on daily charts within the ThinkOrSwim (TOS) platform. Its primary goal is to assist traders in detecting potential turning points where a downtrend may reverse into an uptrend, enabling timely entry points for long positions. The script outputs a binary signal (1 or 0) compatible with the Stock Hacker tool on daily aggregation, making it ideal for scanning large datasets to filter stocks exhibiting these patterns.
Functionality:
- Pattern Detection: The script identifies the following bullish reversal patterns:
- Hammer: A small body with a long lower shadow and minimal upper shadow, indicating rejection of lower prices after a downtrend.
- Inverted Hammer: A small body with a long upper shadow and minimal lower shadow, suggesting bullish rejection after a downtrend.
- Bullish Engulfing: A larger bullish candle that fully engulfs the previous bearish candle, signaling strong buying pressure.
- Piercing Line: A bullish candle that opens below the prior bearish candle’s low and closes above its midpoint, indicating a potential reversal.
- Morning Star: A three-candle pattern with a bearish candle, a small indecisive candle, and a bullish candle closing well above the first candle’s midpoint.
- Bullish Harami: A small bullish candle within the range of the prior bearish candle, hinting at a slowdown in selling pressure.
- Tweezer Bottom: Two candles with equal lows, where the second is bullish, suggesting support and a potential reversal.
- Downtrend Confirmation: Each pattern requires a prior downtrend, defined as the previous day’s close being lower than the close five bars ago, ensuring the reversal context.
- Volume Validation: Most patterns include a volume condition (current volume > previous volume) to confirm the strength of the reversal signal.
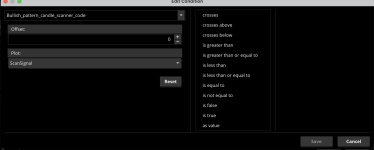
- Output: The script combines all pattern detections into a single bullishPattern variable. The ScanSignal plot returns 1 if any pattern is detected, triggering a green upward arrow on the chart, and 0 otherwise, designed for use in the TOS Stock Hacker.
- The script is declared as lower to ensure compatibility with the scanner interface.
- It uses price data (open, high, low, close) and volume from the prior day ([1]) and two days ago ([2]) to evaluate patterns.
- The logic employs conditional statements and mathematical comparisons (e.g., absValue, >, <) to define candle characteristics and trends.
Limitations: The simplified downtrend definition and lack of advanced filtering (e.g., trend strength or confirmation candles) may lead to false positives. Users should validate signals with broader market context and risk management strategies. You can always add to the scanner to make it stricter. I have added an RSI feature that helps limit and focus on stock that are starting to show bullish tendencies. You can add a MACD feature to implement this even further.
This script provides a practical, automated solution for spotting bullish reversal opportunities, enhancing trading efficiency within the TOS ecosystem.
https://tos.mx/!fzEBVG8E this the script below. Created to use in the scanner
Code:
# Bullish Reversal Patterns Scanner
# Description: Detects Hammer, Inverted Hammer, Bullish Engulfing, Piercing Line, Morning Star, Bullish Harami, Tweezer Bottom on daily charts.
# Output: 1 if any pattern is detected, 0 otherwise. Use in Stock Hacker (Daily aggregation).

declare lower;  # For scanner compatibility

# Define prior downtrend (simplified: lower close than 5 bars ago)
def downtrend = close[1] < close[5];

# Hammer
def hammerBody = absValue(open[1] - close[1]);
def hammerLowerShadow = low[1] < (close[1] - hammerBody * 2) and low[1] < open[1] - hammerBody * 2;
def hammerUpperShadow = high[1] < close[1] + hammerBody * 0.5;
def isHammer = downtrend[1] and hammerLowerShadow and hammerUpperShadow and volume[1] > volume[2];

# Inverted Hammer
def invHammerBody = absValue(open[1] - close[1]);
def invHammerUpperShadow = high[1] > (close[1] + invHammerBody * 2) and high[1] > open[1] + invHammerBody * 2;
def invHammerLowerShadow = low[1] < close[1] - invHammerBody * 0.5;
def isInvHammer = downtrend[1] and invHammerUpperShadow and invHammerLowerShadow and volume[1] > volume[2];

# Bullish Engulfing
def isBullEngulfing = downtrend[1] and open[1] < close[2] and close[1] > open[2] and close[1] > open[1] and volume[1] > volume[2];

# Piercing Line
def isPiercing = downtrend[1] and open[1] < low[2] and close[1] > (open[2] + (close[2] - open[2]) / 2) and close[1] > open[1] and volume[1] > volume[2];

# Morning Star
def isMorningStar = downtrend[1] and close[2] < open[2] and open[1] > close[2] and close[1] > open[2] + (close[2] - open[2]) * 0.5 and volume[1] > volume[2];

# Bullish Harami
def isBullHarami = downtrend[1] and open[1] > open[2] and close[1] < close[2] and open[1] < close[2] and close[1] > open[2] and volume[1] > volume[2] * 0.5;

# Tweezer Bottom
def isTweezerBottom = downtrend[1] and low[1] == low[2] and close[1] > open[1] and volume[1] > volume[2];

# Combine all patterns
def bullishPattern = isHammer or isInvHammer or isBullEngulfing or isPiercing or isMorningStar or isBullHarami or isTweezerBottom;

# Scanner Output
plot ScanSignal = if bullishPattern then 1 else 0;
ScanSignal.SetDefaultColor(Color.GREEN);
ScanSignal.SetPaintingStrategy(PaintingStrategy.BOOLEAN_ARROW_UP);
ScanSignal.SetLineWeight(3);
Last edited by a moderator: