Bullish Market Entry Point for ThinkorSwim

BenTen

Administrative
Staff member
Staff
VIP
Lifetime
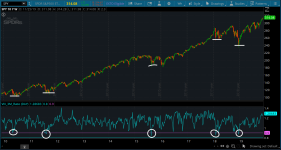
In case there is a HUGE crash tomorrow, you know where to buy the dip :)

Plots the ratio between the VIX3m and the VIX to show potential entry points (.8 - .9).

1gyUwhp.png


thinkScript Code

Code:
# VIX3M/VIX Ratio
# Assembled by BenTen at useThinkScript.com
# Converted from https://www.tradingview.com/script/klHaJXYn-VIX3M-VIX-Ratio/

declare lower;

def U = close("VIX3M");
def D = close("VIX");
def UDL = U / D;

plot ratio = UDL;

plot l1 = 0.8;
plot l2 = 0.9;

l1.SetDefaultColor(GetColor(1));
l2.SetDefaultColor(GetColor(0));
 

Attachments

  • 1gyUwhp.png
    1gyUwhp.png
    170.1 KB · Views: 339
Last edited:
Rather than monitor the VIX too rigidly, my practice has always been to monitor the front month /VX versus the back month /VX to observe the effects of contango and backwardation. The last time we were in a severe backwardation state was in December 2018. We're at least more than 2 points from any chance of that happening
 
@BenTen We have been in a contango state essentially for the entire 2019, except for the week of 1.6.2019 and 8.25.2019 when we were mildly in a backwardation state (in regard to /VX). Many people refer to that as the volatility futures had flipped where risk is happening at the present time as compared to risk 60 or even 90 days out.

In your trading view link above I believe they are measuring something very similar but using "cash" products. I prefer to use the futures to give me more insight. I have VIX, VIX3M, as well as VIX9D on my watchlist purely as a reference point but pay more attention to the futures volatility products

Hope this helps
 
Last edited:
@Playstation Nope, only for SPX.

Just think about what the VIX measures - volatility of calls and puts on the S&P 500. Since the VIX is a 30 day measure, that's the timeframe of concern. There are other timeframes as I mentioned earlier. Typically traders look at the VIX on a daily basis. Personally I use the /VX futures rather than the VIX. One looks at the future expectation while the other looks at what action had already transpired.
 
Last edited by a moderator:
Okay tried on desktop.
Can work for SPY SPX ES. But only from 4H to Day chart.
Doesn't work on mobile.
If I'm reading correctly, it shows that the SnP is gradually getting to a boiling point that it is primed for the downturn already?
 
@Playstation Indeed - the volatility futures is one measure of market internals. There are other measures like advance decline ratios, TICKS - whether extreme, volumes traded on /ES and I do look at how the bonds are performing as well. The market has been over extended to one side for a long time, and reversion to the mean is something that most traders look for. Hope that helps
 
@JarJar168 What are you trying to scan for? If you didn't notice, the indicator provides the same value regardless of which ticker you look at.
 
@JarJar168 Sounds like you're new to trading. There are a group of ticker symbols that measure the underlying sentiment and health of the financial markets. Collectively these are known as market internals.

Let me give you an analogy. Imagine you are a pilot of a commercial jet airliner. You absolutely need to have instrumentation to tell you the speed and other factors that help you make decisions for the duration of your flight. In a similar fashion market internals gives traders information about the underlying state of the market. You typically do not scan for information but place this in a watchlist and learn how to interpret those numbers.

I found a relatively easy article for beginners to understand market internals. It has easy to understand examples. Please note that there are a lot more that the article does not discuss but this should be sufficient to get you started in understanding the concept.

https://www.traderslog.com/market-internals
 
@tomsk I can't quite make out the low quality image in traderslog.
$UVOL-$DVOL | $UVOL/Q-$DVOL/Q
$ADVN-$DECN | $ADVN/Q-$DECN/Q
$TRIN | $TRIN/Q
$TICK | TICK/Q

Did my poor eyes got them right?
 
@Playstation You got all of them right except in the last line. It should be

$TICK | $TICK/Q

All of these should be prefixed by "$".
And in case you didn't know what these symbols meant, I'll save you the trouble
Here you go my friend ...

Code:
$UVOL        NYSE Advanced Volume
$UVOL/Q     NASDAQ Advanced Volume
$DVOL        NYSE Declined Volume
$DVOL/Q     NASDAQ Declined Volume

$ADVN        NYSE Advanced Issues
$ADVN/Q     NASDAQ Advanced Issues

$DECN        NYSE Declined Issues
$DECN/Q     NASDAQ Declined Issues

$TICK         NYSE TICK
$TICK/Q     NASDAQ TICK

$TRIN        NYSE TRIN
$TRIN/Q     NASDAQ TRIN

These are a lot more symbols, but these should be enough to get you started
 
Last edited by a moderator:
@Playstation If you have not already done so, you might consider loading the following study

Code:
# TICK and AD Label
# tomsk
# 11.15.2019

input TickSymb = "$TIKSP";
input ADSymb = "$ADSPD";

def TICKS = if !IsNaN(close(TickSymb)) then close(TickSymb) else TICKS[1];
def AD = if !IsNaN(close(ADSymb)) then close(ADSymb) else AD[1];

AddLabel(1, " Tick = " + TICKS, if TICKS < 0 
                                then Color.Pink 
                                else Color.Cyan);
AddLabel(1, " AD = " + AD, if AD < -350 then Color.Pink 
                           else if AD > 350 then Color.Cyan 
                           else if between(AD, -250, 250) then Color.White 
                           else Color.Yellow);

These labels are color coded and tells you if we oscillate from a bullish undertone to a bearish undertone
The tickers in my study are the TICK and Advance/Decline for the S&P 500
 
Shadowtrader shared a chart set up of internals years ago, maybe search YouTube....
 

Join useThinkScript to post your question to a community of 21,000+ developers and traders.

Similar threads

Not the exact question you're looking for?

Start a new thread and receive assistance from our community.

87k+ Posts
462 Online
Create Post

Similar threads

Similar threads

The Market Trading Game Changer

Join 2,500+ subscribers inside the useThinkScript VIP Membership Club
  • Exclusive indicators
  • Proven strategies & setups
  • Private Discord community
  • ‘Buy The Dip’ signal alerts
  • Exclusive members-only content
  • Add-ons and resources
  • 1 full year of unlimited support

Frequently Asked Questions

What is useThinkScript?

useThinkScript is the #1 community of stock market investors using indicators and other tools to power their trading strategies. Traders of all skill levels use our forums to learn about scripting and indicators, help each other, and discover new ways to gain an edge in the markets.

How do I get started?

We get it. Our forum can be intimidating, if not overwhelming. With thousands of topics, tens of thousands of posts, our community has created an incredibly deep knowledge base for stock traders. No one can ever exhaust every resource provided on our site.

If you are new, or just looking for guidance, here are some helpful links to get you started.

What are the benefits of VIP Membership?
VIP members get exclusive access to these proven and tested premium indicators: Buy the Dip, Advanced Market Moves 2.0, Take Profit, and Volatility Trading Range. In addition, VIP members get access to over 50 VIP-only custom indicators, add-ons, and strategies, private VIP-only forums, private Discord channel to discuss trades and strategies in real-time, customer support, trade alerts, and much more. Learn all about VIP membership here.
How can I access the premium indicators?
To access the premium indicators, which are plug and play ready, sign up for VIP membership here.
Back
Top