#// This source code is subject to the terms of the Mozilla Public License 2.0 at https://mozilla.org/MPL/2.0/
#// © blackcat1402
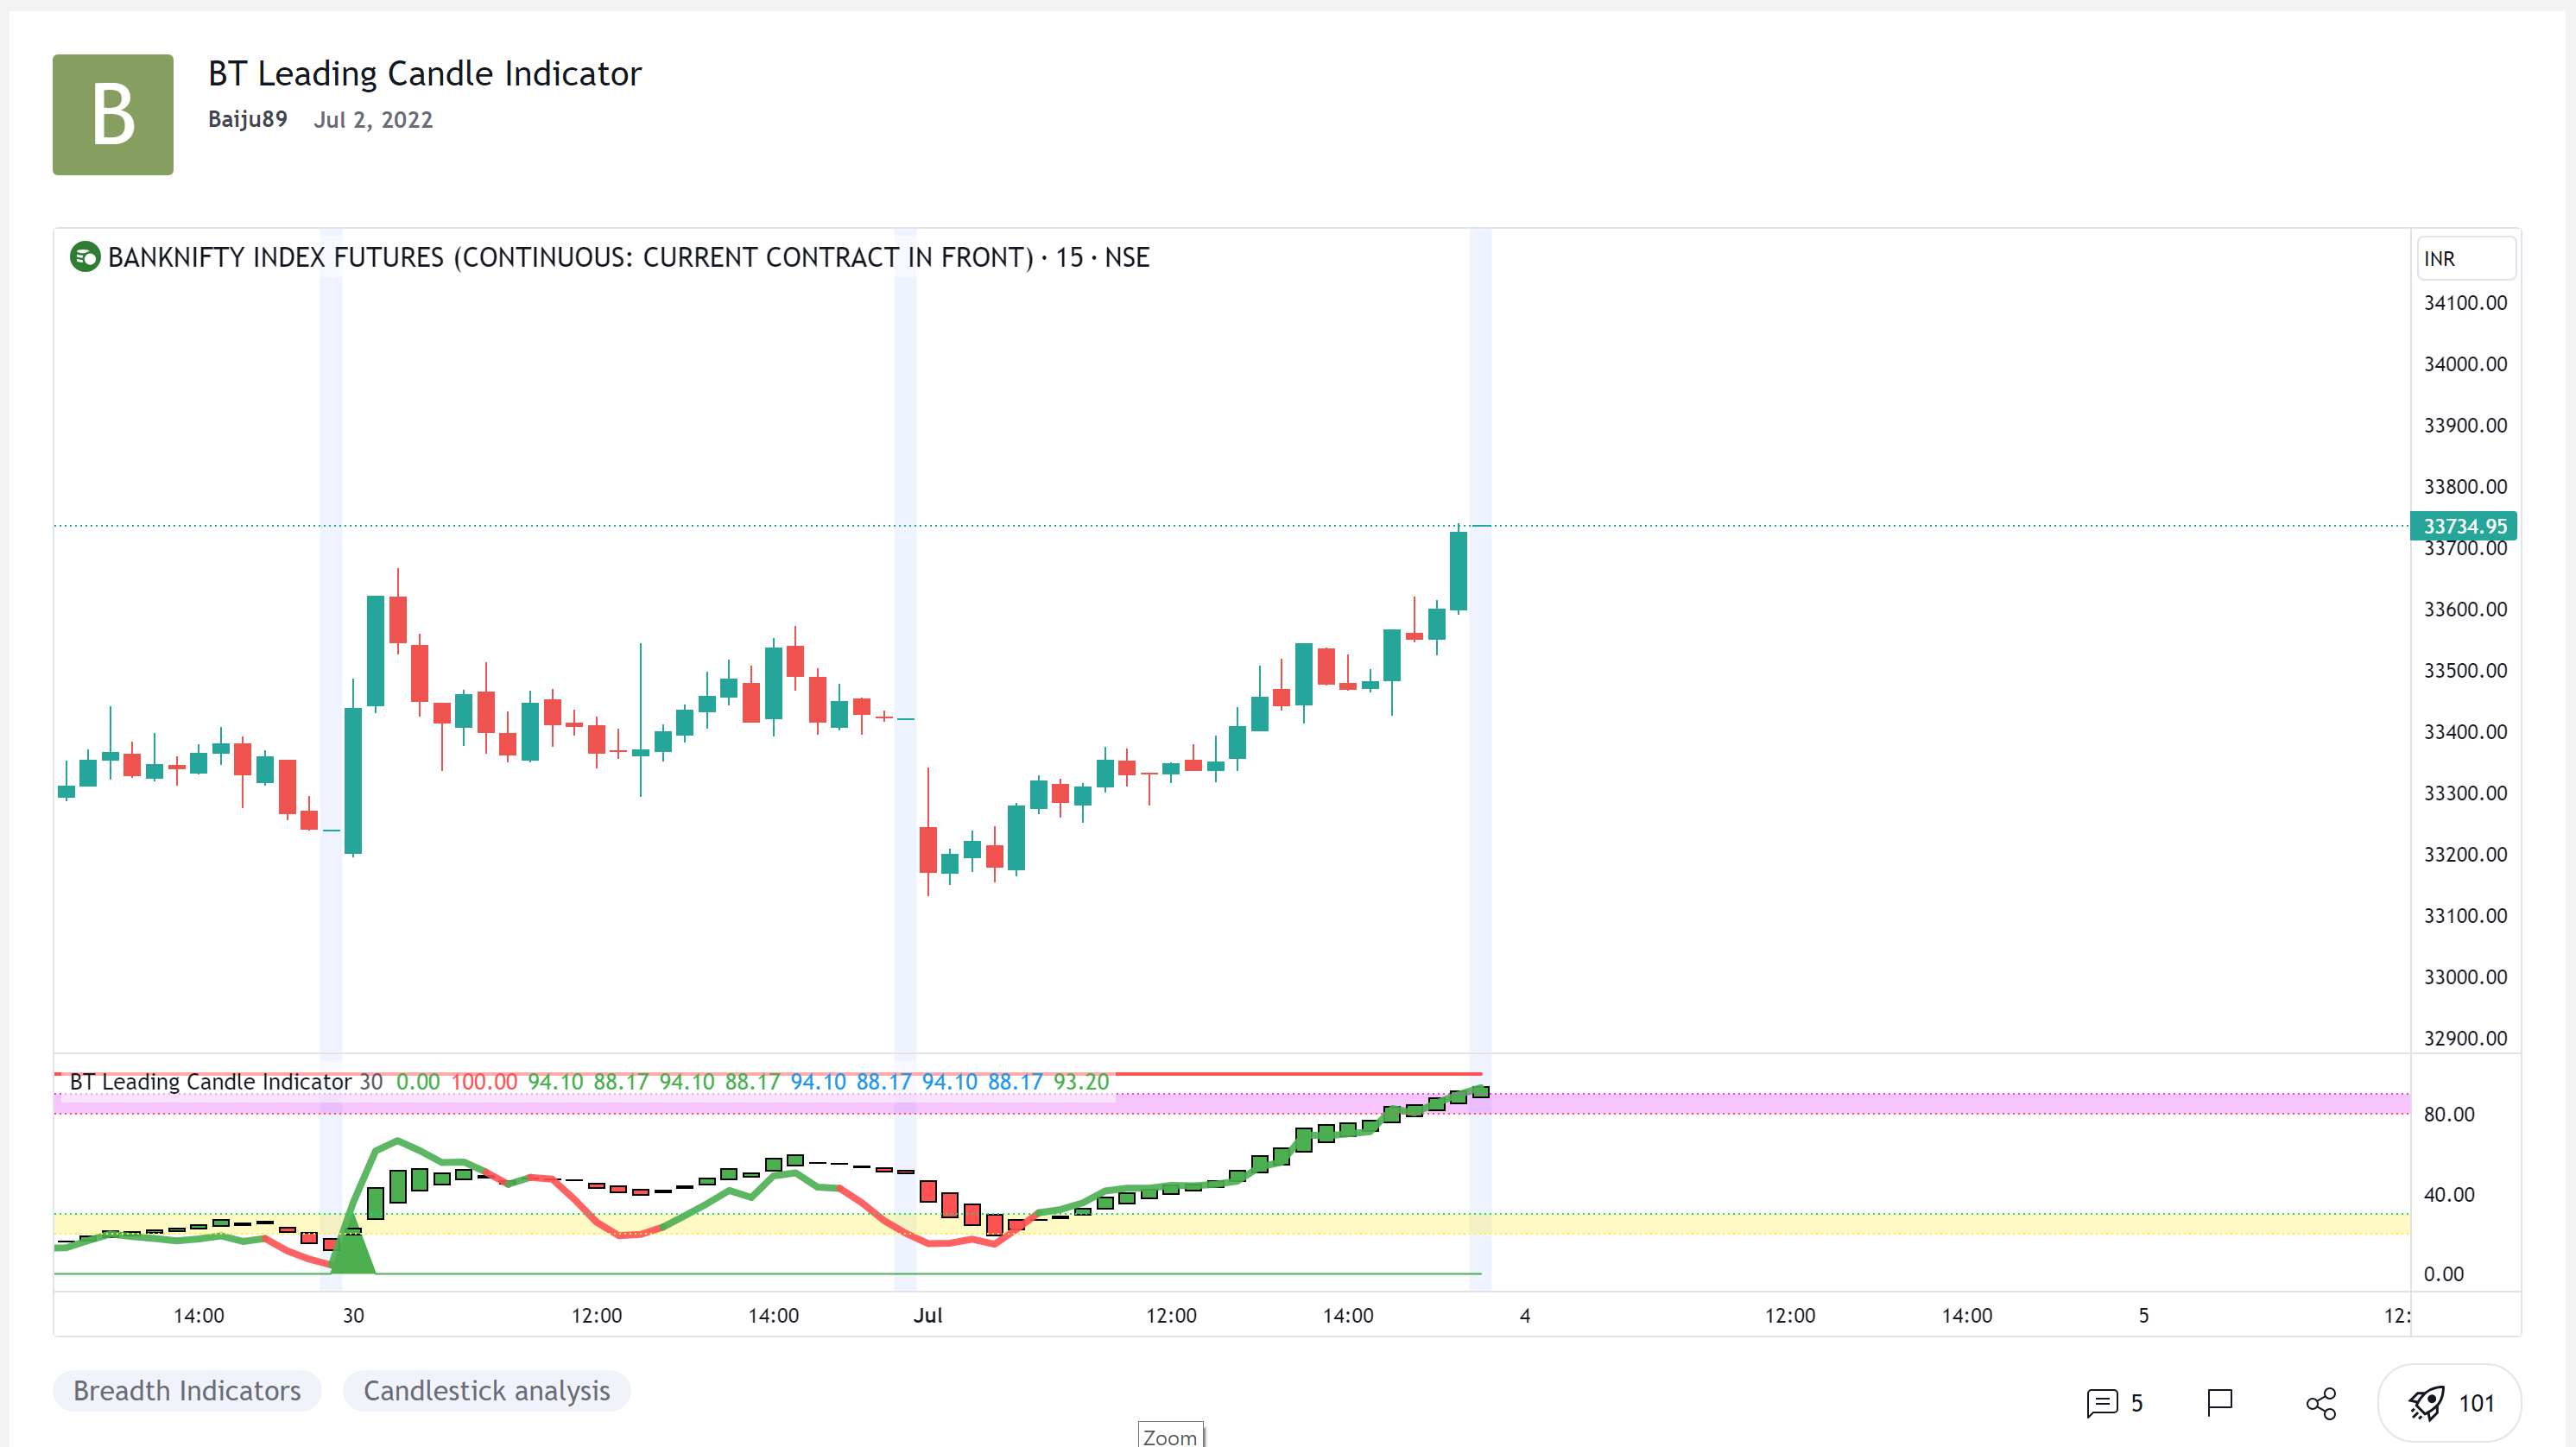
#study("[blackcat] L2 Leading KDJ Candle Indicator", overlay=false)
# Converted by Sam4Cok@Samer800 - 09/2023
declare lower;
#// inputs
input Length = 30;
input leadingKdjStyle = {"Line", "Candles",Default "Line & Candles"};
def na = Double.NaN;
def last = isNaN(close);
def pos = Double.POSITIVE_INFINITY;
def neg = Double.NEGATIVE_INFINITY;
def candle = leadingKdjStyle==leadingKdjStyle."Candles";
def Line = leadingKdjStyle==leadingKdjStyle."Line";
script nz {
input data = 1;
input repl = 0;
def ret_val = if IsNaN(data) then repl else data;
plot return = ret_val;
}
#//functions
#xrf(values, length) =>
script xrf {
input values = close;
input length = 0;
def r_val;
r_val = if length >= 1 then
fold i = 0 to length with p do
if IsNaN(r_val[1]) or !IsNaN(values[i]) then values[i] else r_val[1] else Double.NaN;
plot return = r_val;
}
#xsa(src,len,wei) =>
script xsa {
input src = close;
input len = 0;
input wei = 0;
def sumf;
def ma;
def out;
sumf = CompoundValue(1, sumf[1] - src[len] + src, src);
ma = if IsNaN(src[len]) then Double.NaN else sumf / len;
out = if IsNaN(out[1]) then ma else (src * wei + out[1] * (len - wei)) / len;
plot return = out;
}
#//KDJ indicator
def ll = lowest(low,Length);
def hh = highest(high,Length);
def rsv = (close - ll)/(hh - ll) * 100;
def k_ = xsa(rsv, 3, 1);
def d_ = xsa(k_, 3, 1);
def k = if k_ then k_ else na;
def d = if d_ then d_ else na;
def crossUp = Crosses(k,d, CrossingDirection.ABOVE);
def crossDn = Crosses(d,k, CrossingDirection.BELOW);
def buysig = if d < 25 and crossUp then 30 else 0;
def selsig = if d > 75 and crossDn then 70 else 100;
#//plot buy and sell signal
plot ple = buysig;#,color=color.green, linewidth=1,style=plot.style_area, transp=0)
plot pse = selsig;#,color=color.red, linewidth=2,style=plot.style_line, transp=0)
ple.SetdefaultColor(Color.GREEN);
pse.SetDefaultColor(Color.RED);
AddCloud(pos, pse, Color.DARK_RED);
AddCloud(ple, neg, Color.DARK_GREEN);
#// KDJ leading line
def var1 = (close - Average(close,13))/Average(close,13)*100;
def var2 = (close - Average(close,26))/Average(close,21)*100;
def var3 = (close - Average(close,90))/Average(close,34)*100;
def var4 = (var1 + 3 * var2 + 9 * var3)/13;
def var5 = (100 - AbsValue(var4));
def var10 = lowest(low,10);
def var13 = highest(high,25);
def leadingline = ExpAverage((close - var10)/(var13 - var10) * 4, 4) * 25;
def up = k >= d;
plot pbias = if candle then na else leadingline;
pbias.AssignValueColor(if up then Color.YELLOW else Color.MAGENTA);
pbias.SetLineWeight(2);
# Plot the new Chart
AddChart(high = if up then d else na, low = if Line then na else k , open = k, close = d,
type = ChartType.CANDLE, growcolor = CreateColor(38,166,154));
AddChart(high = if up then na else d , low = if Line then na else k , open = d, close = k,
type = ChartType.CANDLE, growcolor = CreateColor(239,83,80));
#//threshold lines
def h1 = if last then na else 80;#,color=color.red, linestyle=hline.style_dotted)
def h2 = if last then na else 20;#, color=color.yellow, linestyle=hline.style_dotted)
def h3 = if last then na else 10;#,color=color.lime, linestyle=hline.style_dotted)
def h4 = if last then na else 90;#, color=color.fuchsia, linestyle=hline.style_dotted)
AddCloud(h2,h3, Color.VIOLET, Color.VIOLET, yes);
AddCloud(h1,h4, Color.PLUM, Color.PLUM, yes);
# End of CODE