
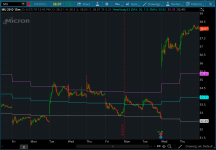
Someone recently asked if it was possible to plot Bollinger Bands from 15m on the 5m chart. The answer is yes, using this indicator.
Example: Displaying the Bollinger Bands of the Hourly chart on the 5m, 15m, or 30m time frame. The indicator is highly configurable and support multi time frame options.
The original version has the simple moving average set to 50 and standard deviation set to 1.0. I modified it so that it is up to date with the Bollinger Bands indicator in ThinkorSwim. You can adjust the values and settings to your liking.


Credit:
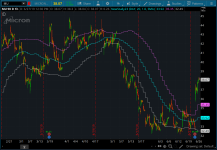
Example: Displaying the Bollinger Bands of the Hourly chart on the 5m, 15m, or 30m time frame. The indicator is highly configurable and support multi time frame options.
The original version has the simple moving average set to 50 and standard deviation set to 1.0. I modified it so that it is up to date with the Bollinger Bands indicator in ThinkorSwim. You can adjust the values and settings to your liking.
thinkScript Code
Code:
# DG_MTFBollingerBands
# Paints Bollinger Bands from higher time period
# onto current time period
#
# Copyright (c) 2017 Daniel Granville

input timeframe = AggregationPeriod.DAY;
input period = 20;
input std = 2.0;
input moving_average_type = {default SMA, EMA};

def data = close(period = timeframe);
def band = StDev(data, period);

plot MidLine;

switch(moving_average_type) {
    case SMA:
        MidLine = Average(data, period);
    case EMA:
        MidLine = ExpAverage(data, period);
}

plot BBandTop = MidLine + band;

plot BBandBot = MidLine - band;
Credit:
Attachments
Last edited:
")