
3
3AMBH
Guest
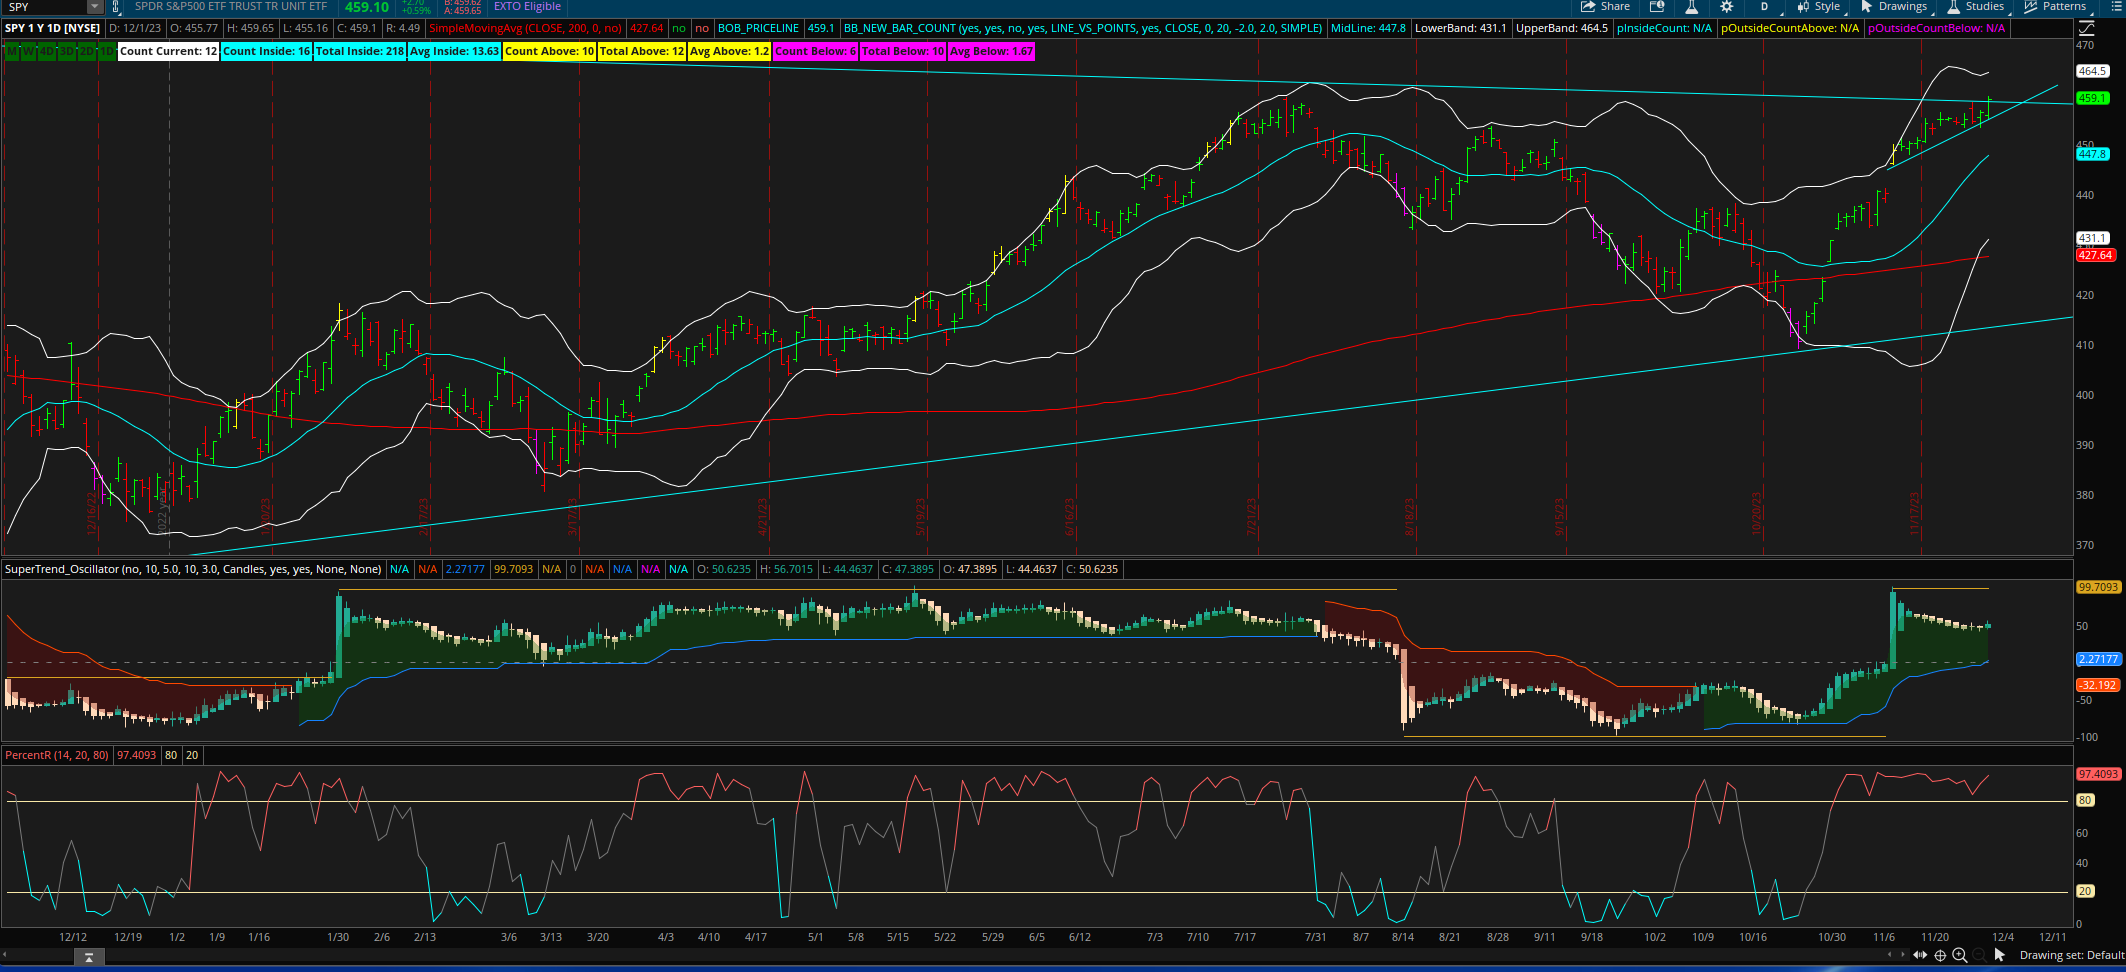
Bollinger Bands Enhanced-Labels-Inside Bar Count & More
In 2019 I hired Kory Gill, a master thinkorswim scripter to create a Bollinger Band script. My goal was to be able to easily see on a chart how many inside bars there For those you know Kory Gill he went the distance and added bells & whistles that I still do not yet use. Bollinger Band experts may understand the code better than I do.
Current Count Inside, Total Bars Inside, Average Inside, Count Above, Total Above, Average Above, Count Below, Total Below, Average Below. Each group is color coded.
Code
Ruby:
BB_InsideBarCount_v5
#
# Author: Kory Gill, @korygill
#
# VERSION HISTORY - sortable date and time (your local time is fine), and your initials
# 20190916-1200-KG - Created.
# 20191025-1400-KG - Added counts for bubbles.
# 20191026-1600-KG - Fixed issue when bubbles turned off.
#

declare once_per_bar;

#
# input
#
input IsOnUpperStudy = yes;
input ShowLabels = yes;
input ShowUpperChartBubble = yes;
input ShowLowerChartBubble = yes;
input LowerPaintStrategy = PaintingStrategy.Line_VS_POINTS;
input ShowZeroPlots = no;
input price = close;
input displace = 0;
input length = 20;
input Num_Dev_Dn = -2.0;
input Num_Dev_up = 2.0;
input averageType = AverageType.Simple;

#
# logic
#
def bn = BarNumber();
def nan = Double.NaN;

#
# Bollinger Bands
#
def sDev = stdev(data = price[-displace], length = length);

def ml = MovingAverage(averageType, data = price[-displace], length = length);
def lb = ml + num_Dev_Dn * sDev;
def ub = ml + num_Dev_Up * sDev;

plot MidLine = if IsOnUpperStudy then ml else nan;
plot LowerBand = if IsOnUpperStudy then lb else nan;
plot UpperBand = if IsOnUpperStudy then ub else nan;

LowerBand.SetDefaultColor(Color.White);
MidLine.SetDefaultColor(Color.Cyan);
UpperBand.SetDefaultColor(Color.White);

AssignPriceColor(if price > ub
then Color.Yellow
else if price < lb
then Color.Magenta
else if price >= price[1]
then Color.Green
else Color.Red
);

#
# Counts
#
def insideCount;
def outsideCountAbove;
def outsideCountBelow;
def isOutSideBar = price > ub or price < lb;
def countOfInside;
def countOfOutsideAbove;
def countOfOutsideBelow;
def totalOfInside;
def totalOfOutsideAbove;
def totalOfOutsideBelow;

if bn == 1 then
{
insideCount = 0;
outsideCountAbove = 0;
outsideCountBelow = 0;
countOfOutsideAbove = 0;
countOfOutsideBelow = 0;
countOfInside = 0;
}
else
{
if !IsNaN(price) then
{
if isOutSideBar then
{
if price > ub then
{
insideCount = 0;
outsideCountAbove = outsideCountAbove[1] + 1;
outsideCountBelow = 0;
if isoutSideBar != isoutSideBar[1] then
{
countOfInside = countOfInside[1] + 1;
}
else
{
countOfInside = countOfInside[1];
}
countOfOutsideAbove = countOfOutsideAbove[1];
countOfOutsideBelow = countOfOutsideBelow[1];
}
else
{
insideCount = 0;
outsideCountAbove = 0;
outsideCountBelow = outsideCountBelow[1] + 1;
if isoutSideBar != isoutSideBar[1] then
{
countOfInside = countOfInside[1] + 1;
}
else
{
countOfInside = countOfInside[1];
}
countOfOutsideAbove = countOfOutsideAbove[1];
countOfOutsideBelow = countOfOutsideBelow[1];
}
}
else
{
insideCount = insideCount[1] + 1;
outsideCountAbove = 0;
outsideCountBelow = 0;
countOfInside = countOfInside[1];
if price[1] > ub[1] then
{
countOfOutsideAbove = countOfOutsideAbove[1] + 1;
countOfOutsideBelow = countOfOutsideBelow[1];
}
else if price[1] < lb[1] then
{
countOfOutsideAbove = countOfOutsideAbove[1];
countOfOutsideBelow = countOfOutsideBelow[1] + 1;
}
else
{
countOfOutsideAbove = countOfOutsideAbove[1];
countOfOutsideBelow = countOfOutsideBelow[1];
}
}
}
else
{
insideCount = 0;
outsideCountAbove = 0;
outsideCountBelow = 0;
countOfOutsideAbove = 0;
countOfOutsideBelow = 0;
countOfInside = 0;
}
}

def condAbove = isOutSideBar and !isOutSideBar[-1] and price > ub;
def condBelow = isOutSideBar and !isOutSideBar[-1] and price < lb;
def condInside = !isOutSideBar and isOutSideBar[-1];
def condRunning = !IsNaN(price) and IsNaN(price[-1]);

if bn == 1 then
{
totalOfInside = 1;
totalOfOutsideAbove = 0;
totalOfOutsideBelow = 0;
}
else
{
if condAbove then
{
totalOfInside = totalOfInside[1];
totalOfOutsideAbove = totalOfOutsideAbove[1] + outsideCountAbove;
totalOfOutsideBelow = totalOfOutsideBelow[1];
}
else if condBelow then
{
totalOfInside = totalOfInside[1];
totalOfOutsideAbove = totalOfOutsideAbove[1];
totalOfOutsideBelow = totalOfOutsideBelow[1] + outsideCountBelow;
}
else if condInside then
{
totalOfInside = totalOfInside[1] + insideCount;
totalOfOutsideAbove = totalOfOutsideAbove[1];
totalOfOutsideBelow = totalOfOutsideBelow[1];
}
else
{
totalOfInside = totalOfInside[1];
totalOfOutsideAbove = totalOfOutsideAbove[1];
totalOfOutsideBelow = totalOfOutsideBelow[1];
}
}

AddChartBubble(
ShowUpperChartBubble and IsOnUpperStudy and condAbove,
high,
outsideCountAbove,
Color.Yellow,
1);

AddChartBubble(
ShowUpperChartBubble and IsOnUpperStudy and condBelow,
low,
outsideCountBelow,
Color.Magenta,
0);

AddChartBubble(
ShowUpperChartBubble and IsOnUpperStudy and condInside,
high,
insideCount,
Color.Cyan,
1);

AddChartBubble(
ShowUpperChartBubble and IsOnUpperStudy and condRunning,
high,
Max(insideCount, Max(outsideCountAbove, outsideCountBelow)),
Color.White,
1);

AddLabel(
ShowLabels and IsOnUpperStudy,
"Count Current: "+insideCount,
Color.White);

AddLabel(
ShowLabels and IsOnUpperStudy,
"Count Inside: "+countOfInside,
Color.Cyan);

AddLabel(
ShowLabels and IsOnUpperStudy,
"Total Inside: "+totalOfInside,
Color.Cyan);

AddLabel(
ShowLabels and IsOnUpperStudy,
"Avg Inside: "+Round(totalOfInside/countOfInside,2),
Color.Cyan);

AddLabel(
ShowLabels and IsOnUpperStudy,
"Count Above: "+countOfOutsideAbove,
Color.Yellow);

AddLabel(
ShowLabels and IsOnUpperStudy,
"Total Above: "+totalOfOutsideAbove,
Color.Yellow);

AddLabel(
ShowLabels and IsOnUpperStudy,
"Avg Above: "+Round(totalOfOutsideAbove/countOfOutsideAbove,2),
Color.Yellow);

AddLabel(
ShowLabels and IsOnUpperStudy,
"Count Below: "+countOfOutsideBelow,
Color.Magenta);

AddLabel(
ShowLabels and IsOnUpperStudy,
"Total Below: "+totalOfOutsideBelow,
Color.Magenta);

AddLabel(
ShowLabels and IsOnUpperStudy,
"Avg Below: "+Round(totalOfOutsideBelow/countOfOutsideBelow,2),
Color.Magenta);

#AddLabel(
# ShowLabels and IsOnUpperStudy,
# "Current: "+insideCount,
# Color.White);

#AddLabel(
# ShowLabels and IsOnUpperStudy,
# "Inside (C|T|A): "+countOfInside+"|"+totalOfInside+"|"+Round(totalOfInside/countOfInside,2),
# Color.Cyan);

#AddLabel(
# ShowLabels and IsOnUpperStudy,
# "Above (C|T|A): #"+countOfOutsideAbove+"|"+totalOfOutsideAbove+"|"+Round(totalOfOutsideAbove/countOfOutsideAbove,2),
# Color.Yellow);

#AddLabel(
# ShowLabels and IsOnUpperStudy,
# "Outside (C|T|A): "+countOfOutsideBelow+"|"+totalOfOutsideBelow+"|"+Round(totalOfOutsideBelow/countOfOutsideBelow,2),
# Color.Magenta);

#
# LOWER STUDY plots
#
plot pInsideCount = if !IsOnUpperStudy
then if ShowZeroPlots then insideCount
else if !ShowZeroPlots and insideCount != 0 then insideCount
else nan
else nan;
plot pOutsideCountAbove = if !IsOnUpperStudy
then if ShowZeroPlots then outsideCountAbove
else if !ShowZeroPlots and outsideCountAbove != 0 then outsideCountAbove
else nan
else nan;

plot pOutsideCountBelow = if !IsOnUpperStudy
then if ShowZeroPlots then outsideCountBelow
else if !ShowZeroPlots and outsideCountBelow != 0 then outsideCountBelow
else nan
else nan;

pInsideCount.SetDefaultColor(Color.Cyan);
pOutsideCountAbove.SetDefaultColor(Color.Yellow);
pOutsideCountBelow.SetDefaultColor(Color.Magenta);

pInsideCount.SetPaintingStrategy(LowerPaintStrategy);
pOutsideCountAbove.SetPaintingStrategy(LowerPaintStrategy);
pOutsideCountBelow.SetPaintingStrategy(LowerPaintStrategy);

AddChartBubble(
ShowLowerChartBubble and !IsOnUpperStudy and isOutSideBar and !isOutSideBar[-1] and price > ub,
outsideCountAbove,
outsideCountAbove,
Color.Yellow,
1);

AddChartBubble(
ShowLowerChartBubble and !IsOnUpperStudy and isOutSideBar and !isOutSideBar[-1] and price < lb,
outsideCountBelow,
outsideCountBelow,
Color.Magenta,
1);

AddChartBubble(
ShowLowerChartBubble and !IsOnUpperStudy and !isOutSideBar and isOutSideBar[-1],
insideCount,
insideCount,
Color.Cyan,
1);

AddChartBubble(
ShowLowerChartBubble and !IsOnUpperStudy and !IsNaN(price) and IsNaN(price[-1]),
Max(insideCount, Max(outsideCountAbove, outsideCountBelow)),
Max(insideCount, Max(outsideCountAbove, outsideCountBelow)),
Color.White,
1);

# END - BB_InsideBarCount
Last edited by a moderator: