Hi
@profitmaya,
I need a clean and clear chart in order to take a daytrade. Day trading is a quite risky as it is, and if I have to hold and stare at a chart for a few hours, it needs to have clarity.
Since I am completely unfamiliar with all the other goodies that SwingArm comes with, I only use the actual SwingArm, the ATR Trail dots, and the Opening Range Break indicator. I'm sorry, im not in an experienced position to tell you what you are doing wrong, but I suspect that you are looking for too many things, instead of just focusing on the actual price action relative to the levels. I don't think any indicator will trade for you, but they can definitely guide you towards a high probability entry. Any entry can fail, at any time, that is how this game is played.
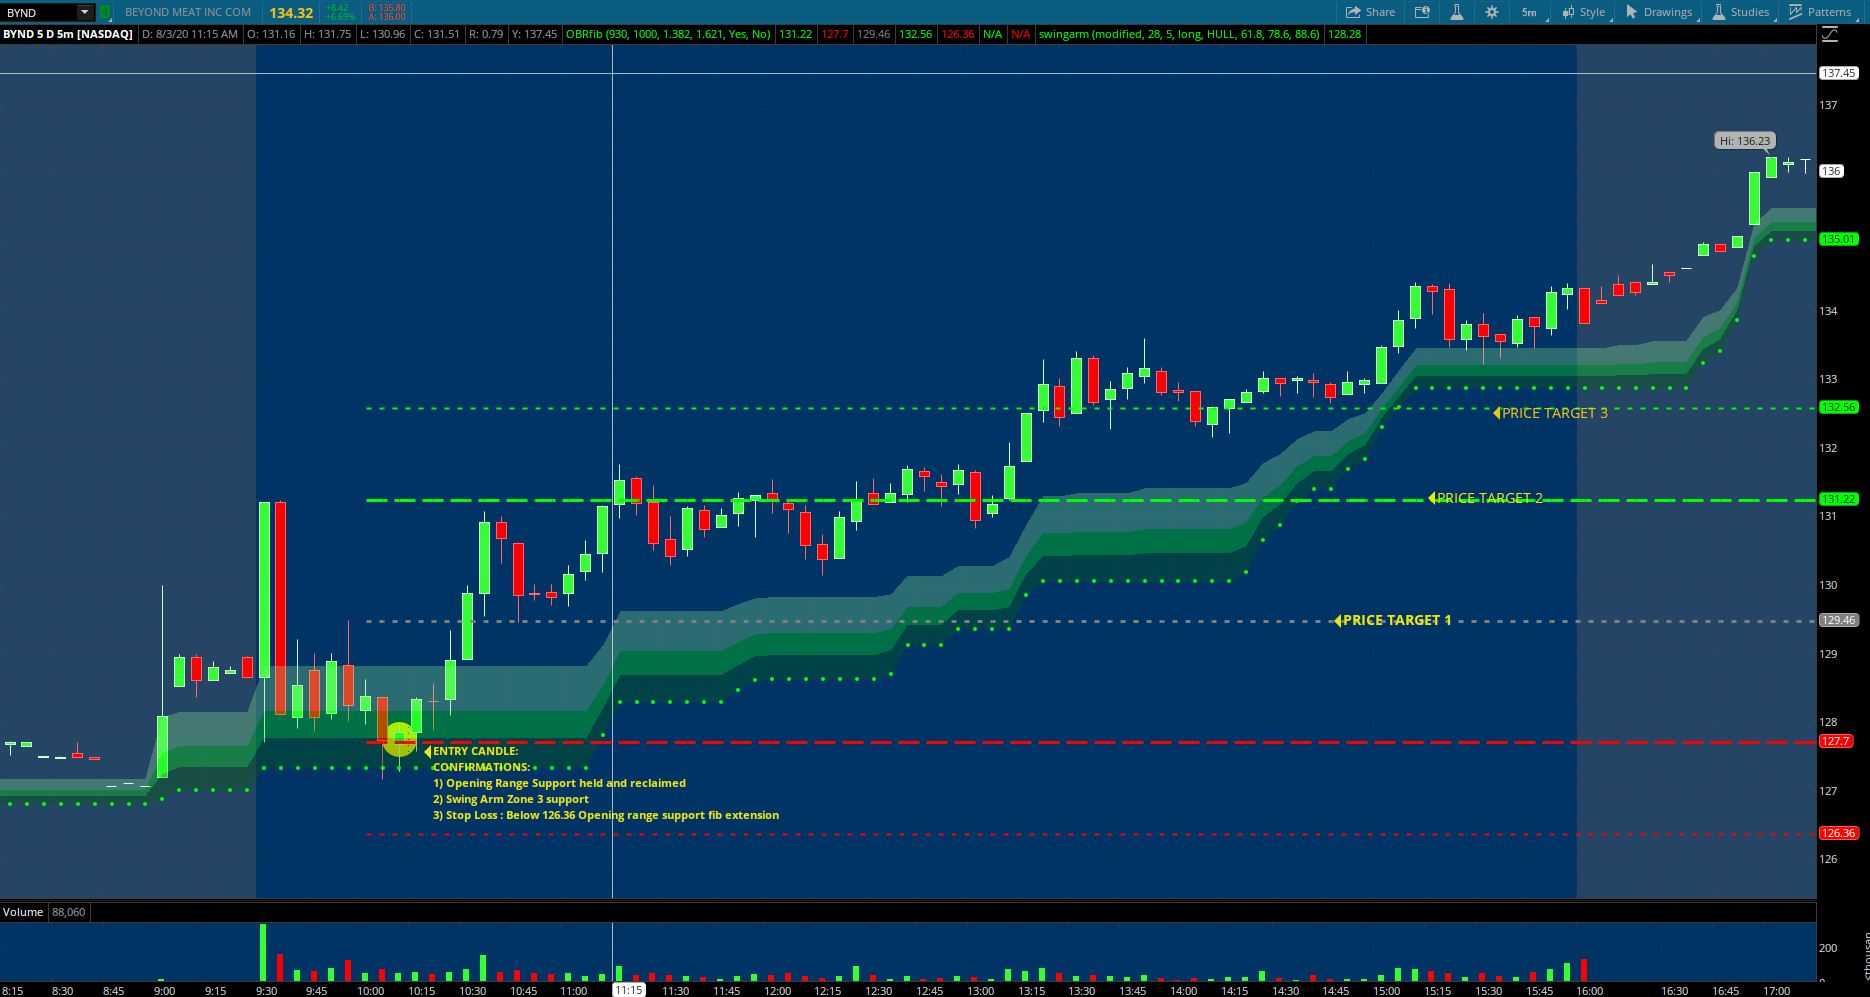
In this example, BYND, from today, I watched it pop out at open, then sell off right back into Swing Arm. Once the Opening Range Indicator began printing (it prints at 10am based on default setting)
Once the ORB RED LINE formed, I watched as the price held that line as support and SwingArm zone3. Once it reclaimed that line, I entered on the first candle that closed above the red line.
I think you can get the Opening range breakout indicator on this forum, just do a quick search for it.
@profitmaya Maybe try and play the SwingArm pullbacks as opposed to the breakouts. You gotta be patient with price action. SwingArm does not control stock prices. You really gotta be patient and that is the hardest part. After you've achieved entry conditions, all you can do is enter the trade and set a mental or hard stop. From what I've observed with SwingArm, pullback entries (especially on bigger time frames) will work more times than they will fail, thus if you commit to the setup you should start to see overall success in your entries.
The basics of trading also apply, in conjunction to SwingArm. Trendlines, bull flags, daily support resistance levels etc.
I cannot tell you much about selling or shorting, as most of my plays are long plays. I dunno why, but almost everything seems to react better in bullish conditions. Maybe because the market is on an all time bull run. Just my two cents.
@BenTen ORB is a legend. I don't leave home without it