
This study calculates the ATM Call and Put using the Black Scholes Options Model and then plots them on the intraday chart of the underlying Symbol.

https://www-tx.mytrade.com/profile/Mobius/statuses/11231658
thinkScript Code
Code:
# Black Scholes Option Plot Series 2 Weekly
# ATM Strike Call and Put
# Mobius at MyTrade
input series = 2; #hint series: 2 is weekly. Anything else and change DaysToExpiration to match.
input DaysToExpiration = 0; #hint DaysToExpiration: 0 = Weekly. For all others change Series to match.
input showLabel = yes;
addLabel(DaysToExpiration != 0, "Change series to match Days To Expiration", color.pink);
def RTHopen = getTime() crosses above RegularTradingStart(getYYYYMMDD());
def c = close;
def DOW = getDayOfWeek(getYYYYMMDD());
def DTE = if DaysToExpiration == 0
then (if DOW == 5
then 3
else if DOW == 4
then 4
else if DOW == 3
then 3
else if DOW == 2
then 3
else if DOW == 1
then 3
else 1)
else DaysToExpiration;
def Strike = if c < 300 and Average(volume(period = AggregationPeriod.DAY), 10) > 20000000
then RoundDown(c / .5, 0) * .5
else if c < 300 and Average(volume(period = AggregationPeriod.DAY)[1], 10) < 20000000
then Floor(c)
else if Between(Floor(c), 300, 500)
then Round(Floor(c) / 5, 0) * 5
else if Between(Floor(c), 500, 1000)
then Round(Floor(c) / 5, 0) * 5
else if c > 1000
then Round(Floor(c) / 10, 0) * 10
else Floor(c);
def strike_ = if isNaN(strike)
then strike_[1]
else strike;
def t = DTE / 365;
def seriesIV = if IsNaN(SeriesVolatility(series = series))
then seriesIV[1]
else SeriesVolatility(series = series);
def rate = ((GetInterestRate() / 365) * DTE);
def CurrDivi = if IsNaN(GetDividend())
then CurrDivi[1]
else GetDividend();
def LastDividend = if CurrDivi != CurrDivi[1]
then CurrDivi[1]
else LastDividend[1];
def YearlyDiv = if LastDividend == 0
then CurrDivi * 4
else if LastDividend < CurrDivi
then (LastDividend * 3) + CurrDivi
else YearlyDiv[1];
def DivYeild = YearlyDiv / c;
def LogR = Log(c / Strike);
def Denominator = LogR + (rate - DivYeild + Power(seriesIV, 2) / 2) * t;
def Divisor = seriesIV * Sqrt(t);
def D1 = Denominator / Divisor;
def D2 = D1 - seriesIV * Sqrt(t);
# Abramowiz Stegun Approximation for Cumulative Normal Distribution
script cnd
{
input data = 1;
def a = AbsValue(data);
def b1 = .31938153;
def b2 = -.356563782;
def b3 = 1.781477937;
def b4 = -1.821255978;
def b5 = 1.330274429;
def b6 = .2316419;
def e = 1 / (1 + b6 * a);
def i = 1 - 1 / Sqrt(2 * Double.Pi) * Exp(-Power(a, 2) / 2) *
(b1 * e + b2 * e * e + b3 * Power(e, 3) + b4 * Power(e, 4) + b5 * Power(e, 5));
plot CND = if data < 0
then 1 - i
else i;
}
def Call = (c * cnd(D1) - Strike * Exp(-rate * t) * cnd(D2));
def call_ = if isNaN(call)
then call_[1]
else call;
def put = (Strike * Exp(-rate * t) * cnd(-D2) - c * cnd(-D1));
def put_ = if isNaN(put)
then put_[1]
else put;
def tBar = if isNaN(close[-1]) and !isNaN(close)
then barNumber()
else tBar[1];
plot StrikeLine = if barNumber() >= highestAll(tBar)
then highestAll(if isNaN(close[-1])
then Strike_
else double.nan)
else double.nan;
addChartBubble(barNumber() == HighestAll(barNumber()),
StrikeLine,
"C " + AsDollars(Call_),
color.green,
yes);
addChartBubble(barNumber() == HighestAll(barNumber()),
StrikeLine,
"P " + AsDollars(Put_),
color.red,
no);
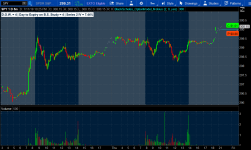
addLabel(showLabel, "D.O.W. = " + DOW +
" | Day to Expiry on B.S. Study = " + DTE +
" | Series " + series + " IV = " + AsPercent(seriesIV), color.white);
# End CodeShareable Link
https://tos.mx/edQQcYhttps://www-tx.mytrade.com/profile/Mobius/statuses/11231658
Attachments
Last edited by a moderator: