
There was not much information written about this indicator. Take it as is.

thinkScript Code
Code:
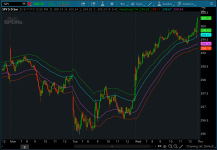
# ATR Breakouts
# Assembled by BenTen at useThinkScript.com
# Converted from https://www.tradingview.com/script/RqEk3iZu/

def long_entry = (expAverage(close, 50)) + (2 * atr(20));
def short_entry = (expAverage(close, 50)) - (2 * atr(20));

def short_stop_loss = (expAverage(close, 50)) + (atr(20));
def long_stop_loss = (expAverage(close, 50)) - (atr(20));

plot b_entry = long_entry;
plot s_entry = short_entry;
plot s_stop = short_stop_loss;
plot l_stop = long_stop_loss;

b_entry.SetDefaultColor(GetColor(6));
s_entry.SetDefaultColor(GetColor(5));
s_stop.SetDefaultColor(GetColor(1));
l_stop.SetDefaultColor(GetColor(0));
Attachments
Last edited: