Automatic Long and Short Fibonacci Level Indicators for ThinkorSwim

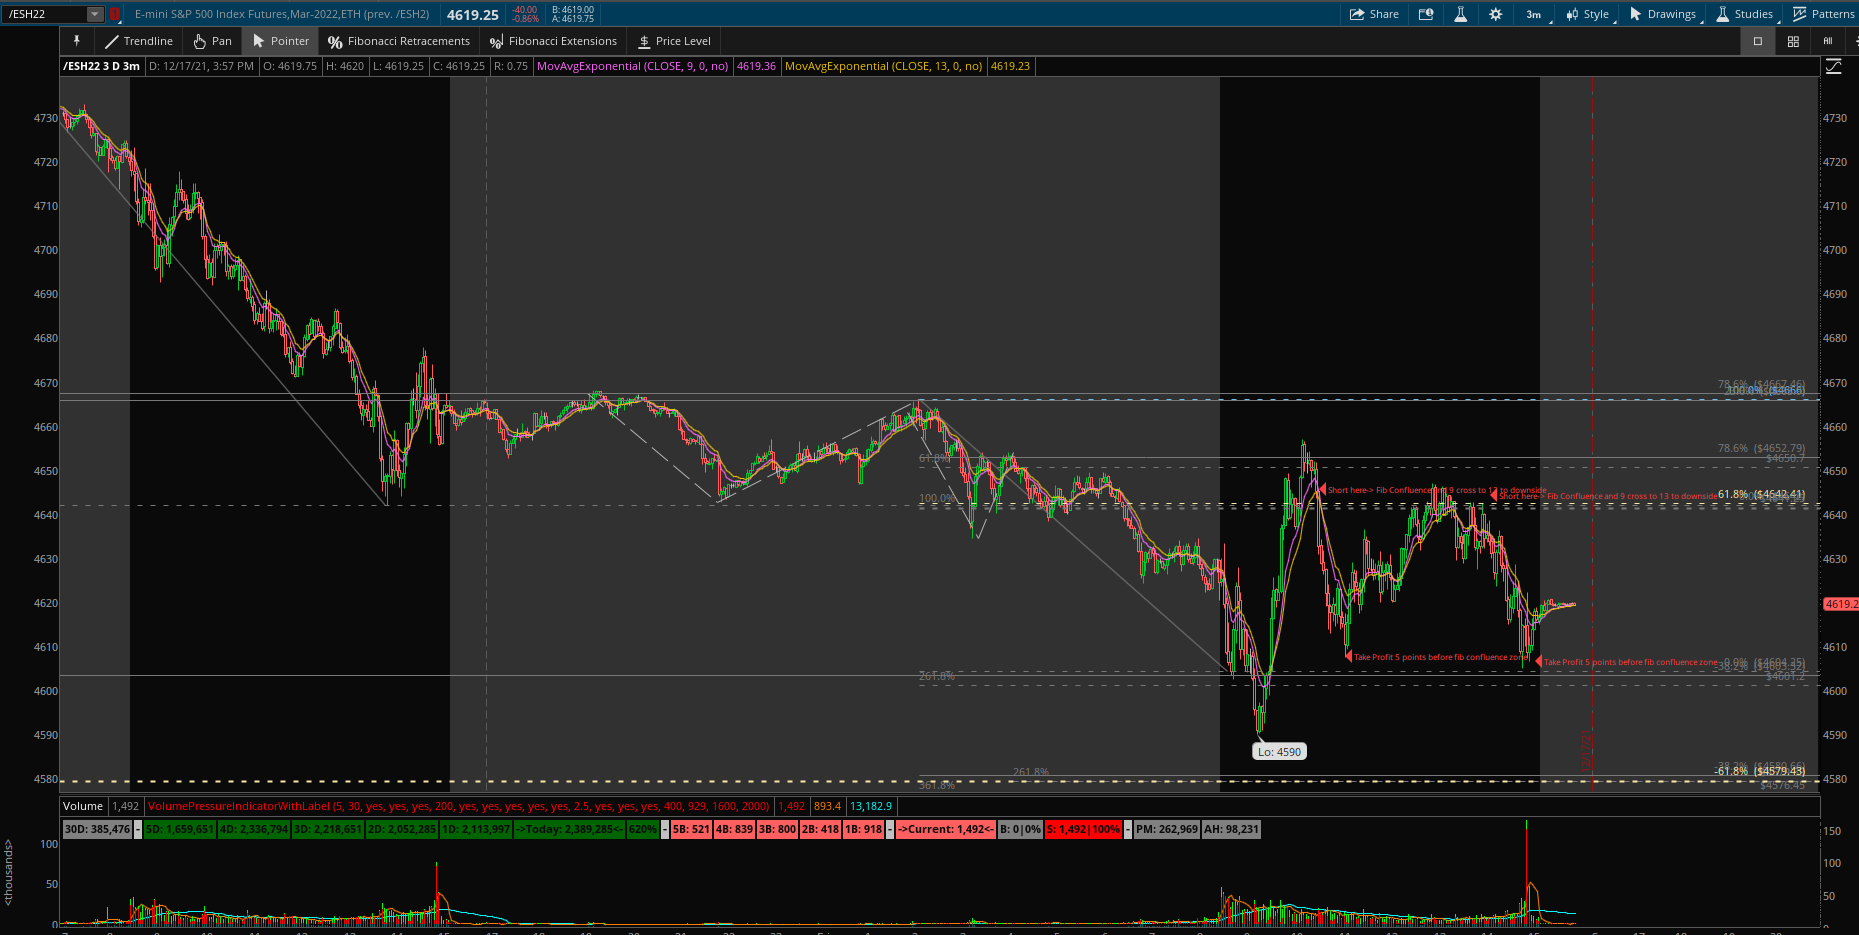
@chewie76 : Thank you for this wonderful study. I'm looking for some automation of fib confluence levels. The idea is as below

1. Draw prior day high to low or low to high fib levels
2. Draw pre-market high to low or low to high fib levels
3. Draw extension projections ( high to low or low to high )
4. Keep only the co-efficients where the price almost meets ( confluence )
5. If price is near confluence area and 5/13 ema cross over to downside then short or vice versa.

Please see the idea in the follow graph along with some notes. Is this possible to do automated fashion or atleast draw the fib levels and i can clean up the non-confluence areas.


jiqw4xV.png
This indicator shows shorts and long positions, so it may be the closest thing you'll find. Not sure how to get it to what you manually drew. May have to keep searching or draw manually.
 

Join useThinkScript to post your question to a community of 21,000+ developers and traders.

hey @chewie76 this looks great! Do you notice any timeframes work better on this than others? Should it be used with extended hours off? I put it on my chart towards the end of the day today.. any idea why a down arrow didn't appear on SPY around 3:45 PM? Do I need to change something in my settings? It showed the zscore down arrow but no fib arrow. Just noticed the same on NVDA today, 1 day 5 minute chart.. there was no up or down arrow

 
hey @chewie76 this looks great! Do you notice any timeframes work better on this than others? Should it be used with extended hours off? I put it on my chart towards the end of the day today.. any idea why a down arrow didn't appear on SPY around 3:45 PM? Do I need to change something in my settings? It showed the zscore down arrow but no fib arrow. Just noticed the same on NVDA today, 1 day 5 minute chart.. there was no up or down arrow

I'm not sure why it didn't show an arrow when it broke lower on both tickers. I have noticed that sometimes it doesn't show. It did hit the target though on SPY. I would keep testing different time settings as you see fit based on your trading style. I use extended hours on.
 
I'm not sure why it didn't show an arrow when it broke lower on both tickers. I have noticed that sometimes it doesn't show. It did hit the target though on SPY. I would keep testing different time settings as you see fit based on your trading style. I use extended hours on.

Thanks! Looking forward to trying it on Monday. Do you ever try to time the reversal and buy calls/puts when it gets near 100% and hope it doesn't break, or do you typically wait until it breaks 78.6%?
 
Thanks! Looking forward to trying it on Monday. Do you ever try to time the reversal and buy calls/puts when it gets near 100% and hope it doesn't break, or do you typically wait until it breaks 78.6%?
I wait till it breaks. You can set an order in advance if you want.
 
Does this work for /ES futures as well? May I know why short arrow is not generated on the 1 minute timeframe after the price breached 78.6

Also, may I know why/when the fresh long fib's will be drawn?

Please check the below link to the chart that I'm referring.
http://tos.mx/5e06U18
 
Last edited:
why is it that only some buys/sells get the arrows on the cross of 78.6 but others don't?
 
Last edited:
How can I increase length of fib lines which are close to price axis? I have all level bubbles covering candles. Thank you
 
All other Automatic Fib indicators look at the past, measure a previous high and previous low and give you levels. This indicator looks into the future and gives you possible high and low price levels. The Automatic Fibonacci Levels are two indicators, one for long positions and one for short positions. Up and Down arrows show entry signals when price crosses the 78.6% level. Entry signal alerts are included. This can be used for both swing trading and day trading based on the t

Shareable Link:
Long position:

http://tos.mx/AyuB4pQ

Short position:
http://tos.mx/1IJ4a4L
@chewie76

I know the post is old but if you're still here I am curious what is the best way to determine whether it should be set up long or short or are you using both studies together and watching the trend line and dominate contacts? I ask because TOS has canned Fib and they automatically decide whether you should be short or long based on criteria they've input I don't know how they decide this but it seems to be more accurate than just deciding if I should be long or short. I know that most traders are not even aware that you flip the Fibonacci over depending on which way you're trading. other than a visual confirmation of trend and pivot points I'm curious if there is something I was missing here.

TOS has been incredibly accurate but they're limited in the adjustment of study. For starters, the bubbles sit right over the moving candles. Nice job btw this is the one I've been using now you obviously saw their issues. For now to simplify and save time I use the canned TOS auto fib to determine long or short strategy first and then I delete it and use these beautiful fibs, Thanks
 
Last edited:
How long does it take for something on the 30min to play out in your experience?

Also, is there a way to extend the fib lines further out because it blocks the price at the moment.
 
Last edited:
@chewie76

I know the post is old but if you're still here I am curious what is the best way to determine whether it should be set up long or short or are you using both studies together and watching the trend line and dominate contacts? I ask because TOS has canned Fib and they automatically decide whether you should be short or long based on criteria they've input I don't know how they decide this but it seems to be more accurate than just deciding if I should be long or short. I know that most traders are not even aware that you flip the Fibonacci over depending on which way you're trading. other than a visual confirmation of trend and pivot points I'm curious if there is something I was missing here.

TOS has been incredibly accurate but they're limited in the adjustment of study. For starters, the bubbles sit right over the moving candles. Nice job btw this is the one I've been using now you obviously saw their issues. For now to simplify and save time I use the canned TOS auto fib to determine long or short strategy first and then I delete it and use these beautiful fibs, Thanks
I've used both on the chart at the same time.
 
Hey @chewie76 , I've been using this indicator the past few days and I really like it so far for swings! One question that I've been trying to discern from the code though is, is this study giving signals based off the retest of the .786 fib after each pivot high/low? And if so, is there a way that you could adjust this to fire off of a .618 fib test (or any of the fib values)?

Thanks so much for your work on this!
 
Hey @chewie76 , I've been using this indicator the past few days and I really like it so far for swings! One question that I've been trying to discern from the code though is, is this study giving signals based off the retest of the .786 fib after each pivot high/low? And if so, is there a way that you could adjust this to fire off of a .618 fib test (or any of the fib values)?

Thanks so much for your work on this!
Yes, you just have to change the up and down arrow in the code to a fib you want to trigger.
 

Similar threads

Not the exact question you're looking for?

Start a new thread and receive assistance from our community.

87k+ Posts
1381 Online
Create Post

Similar threads

Similar threads

The Market Trading Game Changer

Join 2,500+ subscribers inside the useThinkScript VIP Membership Club
  • Exclusive indicators
  • Proven strategies & setups
  • Private Discord community
  • ‘Buy The Dip’ signal alerts
  • Exclusive members-only content
  • Add-ons and resources
  • 1 full year of unlimited support

Frequently Asked Questions

What is useThinkScript?

useThinkScript is the #1 community of stock market investors using indicators and other tools to power their trading strategies. Traders of all skill levels use our forums to learn about scripting and indicators, help each other, and discover new ways to gain an edge in the markets.

How do I get started?

We get it. Our forum can be intimidating, if not overwhelming. With thousands of topics, tens of thousands of posts, our community has created an incredibly deep knowledge base for stock traders. No one can ever exhaust every resource provided on our site.

If you are new, or just looking for guidance, here are some helpful links to get you started.

What are the benefits of VIP Membership?
VIP members get exclusive access to these proven and tested premium indicators: Buy the Dip, Advanced Market Moves 2.0, Take Profit, and Volatility Trading Range. In addition, VIP members get access to over 50 VIP-only custom indicators, add-ons, and strategies, private VIP-only forums, private Discord channel to discuss trades and strategies in real-time, customer support, trade alerts, and much more. Learn all about VIP membership here.
How can I access the premium indicators?
To access the premium indicators, which are plug and play ready, sign up for VIP membership here.
Back
Top