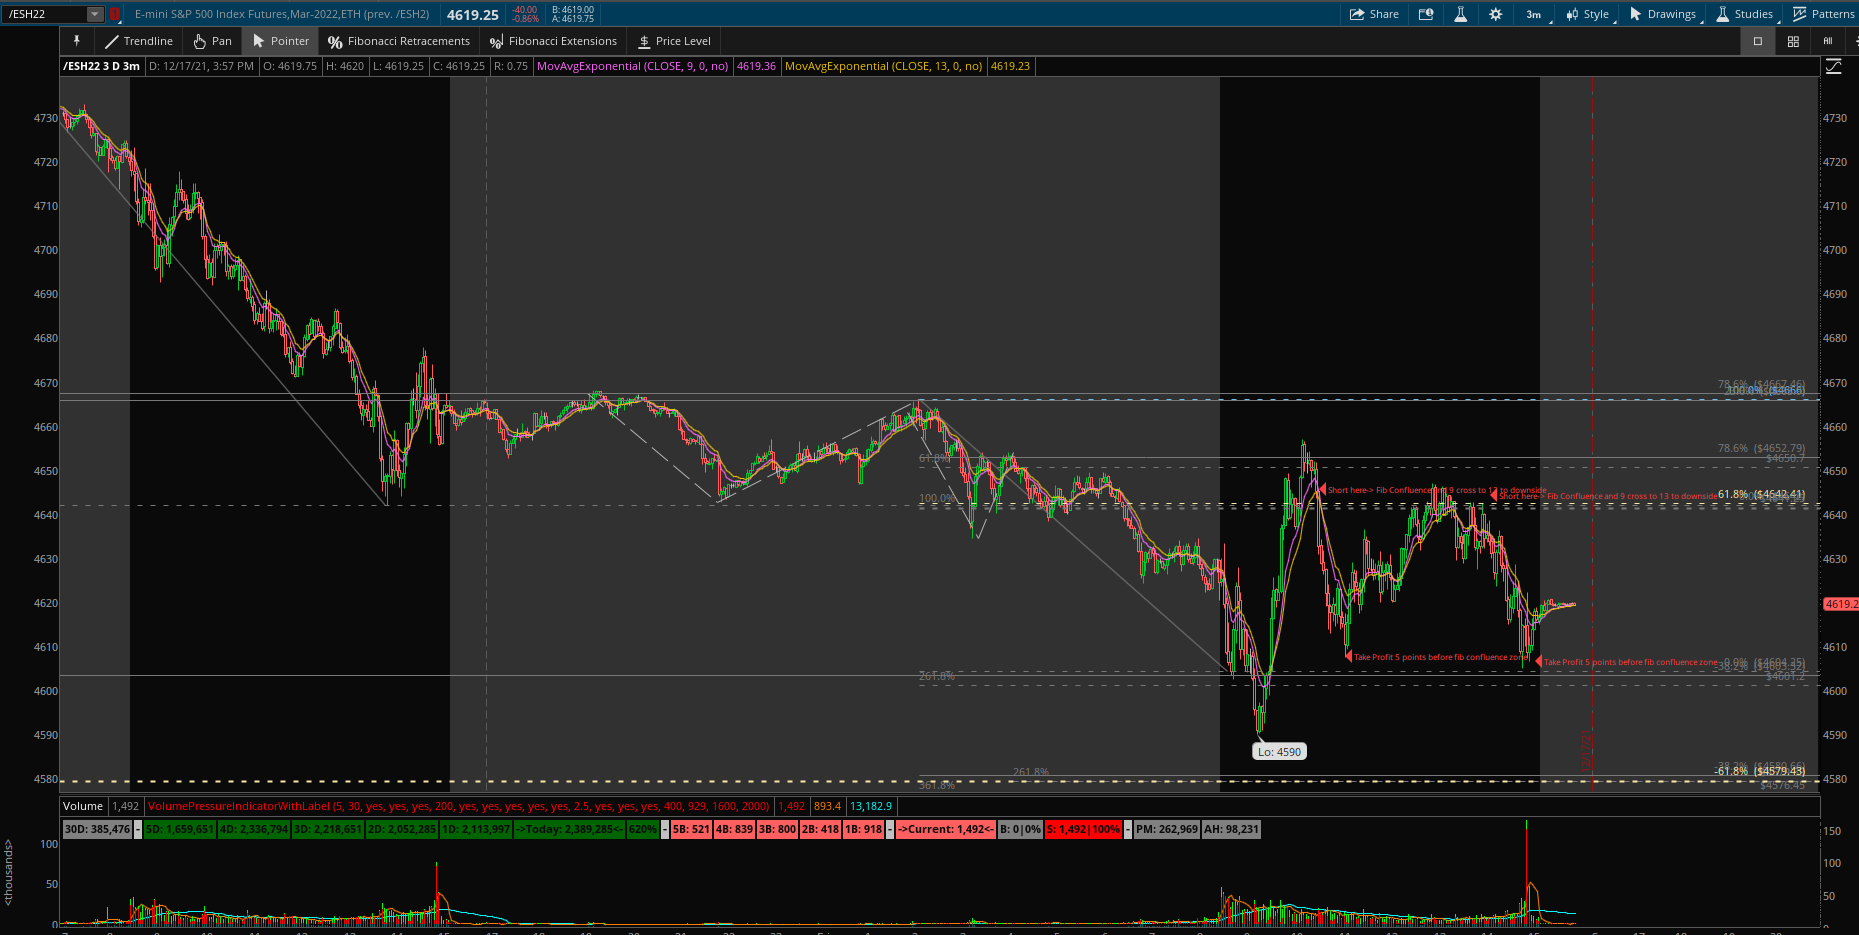
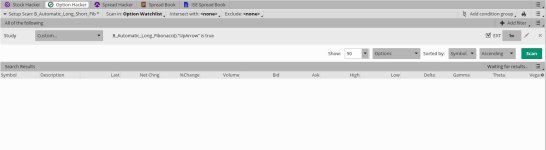
@chewie76 : Thank you for this wonderful study. I'm looking for some automation of fib confluence levels. The idea is as below
1. Draw prior day high to low or low to high fib levels
2. Draw pre-market high to low or low to high fib levels
3. Draw extension projections ( high to low or low to high )
4. Keep only the co-efficients where the price almost meets ( confluence )
5. If price is near confluence area and 5/13 ema cross over to downside then short or vice versa.
Please see the idea in the follow graph along with some notes. Is this possible to do automated fashion or atleast draw the fib levels and i can clean up the non-confluence areas.