Looking to add labels to represent the ATR % distance (based on the open) that dynamically shows the spread from -1ATR and 1ATR as the session starts.
At the open, price will start making its move towards either 1/-1 ATR (based off its 14 day ATR) So the label would then represent the % away from either 1/-1 ATR. +/- 100% would mean either -1ATR or 1ATR was tagged. And logically, the label would still log the % as price moves past the appropriate ATR (e.g. 125% would be price is 25% above 1ATR)
As an example, if price is making its move towards its 1ATR the %ATR label will be increasing numerically.
Would be great if the shading is light green if the price is moving towards 1ATR and red towards -1ATR
this doesn't make sense?
hod, high of day, has nothing to do with ATR. hod is not +1 atr
edit and rewrite your post , maybe remove all the lod and hod.
this doesn't make sense?
hod, high of day, has nothing to do with ATR. hod is not +1 atr
edit and rewrite your post , maybe remove all the lod and hod.
this doesn't make sense?
hod, high of day, has nothing to do with ATR. hod is not +1 atr
edit and rewrite your post , maybe remove all the lod and hod.
Looking to add labels to represent the ATR % distance (based on the open) that dynamically shows the spread from -1ATR and 1ATR as the session starts.
At the open, price will start making its move towards either 1/-1 ATR (based off its 14 day ATR) So the label would then represent the % away from either 1/-1 ATR. +/- 100% would mean either -1ATR or 1ATR was tagged. And logically, the label would still log the % as price moves past the appropriate ATR (e.g. 125% would be price is 25% above 1ATR)
As an example, if price is making its move towards its 1ATR the %ATR label will be increasing numerically.
Would be great if the shading is light green if the price is moving towards 1ATR and red towards -1ATR
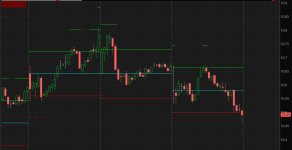
here is my interpretation of your request.
it finds the (2nd agg , hour) ATR at the start of the day and uses that number for the rest of the day
at the beginning of a trading day, read and save the open price (first bar)
.. draws a cyan line from the open
find the ATR
.. can choose a 2nd aggregation period for ATR. default is hour.
.. 2 lines are drawn, 1 at (open + ATR) and other at (open - ATR)
.. if price moves beyond the 1 ATR lines, the next ATR line will be drawn.
.... up to 4 ATR lines can be drawn.
you said 14 day ATR, but i used hour , on a 15min chart.
if ATR day is used, then price never goes past the ATR levels.
for the percent label color,
.. the central price region is gray
.. as price moves up, there are 3 shades of green, dark to light
.. as price moves down, there are 3 shades of red, dark to light
Code:
#ATR_hilo_per_from_open

#https://usethinkscript.com/threads/atr-labels-distance.21153/
#ATR Labels % Distance
#hboogie  6/14

# Looking to add labels to represent
#  the ATR % distance (based on the open)
#  that dynamically shows the spread from -1ATR and 1ATR as the session starts.

#At the open, price will start making its move towards either 1/-1 ATR (based off its 14 day ATR) So the label would then represent the % away from either 1/-1 ATR. +/- 100% would mean either -1ATR or 1ATR was tagged. And logically, the label would still log the % as price moves past the appropriate ATR (e.g. 125% would be price is 25% above 1ATR)

#As an example, if price is making its move towards its 1ATR the %ATR label will be increasing numerically.

#Would be great if the shading is light green if the price is moving towards 1ATR and red towards -1ATR


def na = double.nan;
def bn = barnumber();

# ATR ----------------------
#declare lower;
input length = 14;
#input averageType = AverageType.WILDERS;
input atr_agg = AggregationPeriod.hour;
def ATR = MovingAverage(AverageType.WILDERS, TrueRange(high(period = atr_agg), close(period = atr_agg), low(period = atr_agg)), length);

addlabel(1, " ", color.black);
def agg2min =  atr_agg / 60000;
AddLabel(1, "ATR AGG  " + if agg2min < 60 then (agg2min + " m")
              else if agg2min < 1440 then ((agg2min / 60) + " H")
              else if agg2min < 10080 then (agg2min / (60 * 24) + " D")
              else if atr_agg == AggregationPeriod.WEEK then "W"
              else if atr_agg == AggregationPeriod.MONTH then "M"
              else "", Color.CYAN);


# --------------------------

def start = 0930;
#input end = 1600;
#def daytime = if secondsfromTime(start) >= 0 and secondstillTime(end) > 0 then 1 else 0;
def startbar = (secondsfromTime(start) == 0);


def open1;
def atr1;
if bn == 1 then {
 open1 = 0;
 atr1 = 0;
} else if startbar then {
 open1 = open;
 atr1 = atr;
} else {
 open1 = open1[1];
 atr1 = atr1[1];
}


def atrper = round(100 * (close - open1)/ atr1,2);

addlabel(1, " ", color.black);
addlabel(1,
"ATR % : " + atrper
, (if atrper >= 300 then color.light_green
 else if atrper >= 200 then color.green
 else if atrper >= 100 then color.dark_green
  else if atrper > -100 then color.gray
 else if atrper > -200 then color.dark_red
 else if atrper > -300 then color.red
 else color.light_red));
addlabel(1, " ", color.black);

plot zo1 = if open1 > 0 then open1 else na;
zo1.SetPaintingStrategy(PaintingStrategy.HORIZONTAL);
zo1.SetDefaultColor(Color.cyan);
#zo1.setlineweight(1);
zo1.hidebubble();

#atr1
plot zup1 = if open1 > 0 then (open1+(1*atr1)) else na;
zup1.SetPaintingStrategy(PaintingStrategy.HORIZONTAL);
zup1.SetDefaultColor(Color.green);
#zup1.setlineweight(1);
zup1.hidebubble();

plot zdwn1 = if open1 > 0 then (open1-(1*atr1)) else na;
zdwn1.SetPaintingStrategy(PaintingStrategy.HORIZONTAL);
zdwn1.SetDefaultColor(Color.red);
#zdwn1.setlineweight(1);
zdwn1.hidebubble();

input show_extra_atr_lines = yes;

# atr2
plot zup2 = if show_extra_atr_lines and open1 > 0 and high > (open1+(1*atr1)) then (open1+(2*atr1)) else na;
zup2.SetPaintingStrategy(PaintingStrategy.HORIZONTAL);
zup2.SetDefaultColor(Color.green);
#zup2.setlineweight(1);
zup2.hidebubble();

plot zdwn2 = if show_extra_atr_lines and open1 > 0 and low < (open1-(1*atr1)) then (open1-(2*atr1)) else na;
zdwn2.SetPaintingStrategy(PaintingStrategy.HORIZONTAL);
zdwn2.SetDefaultColor(Color.red);
#zdwn2.setlineweight(1);
zdwn2.hidebubble();

# atr3
plot zup3 = if show_extra_atr_lines and open1 > 0 and high > (open1+(2*atr1)) then (open1+(3*atr1)) else na;
zup3.SetPaintingStrategy(PaintingStrategy.HORIZONTAL);
zup3.SetDefaultColor(Color.green);
#zup3.setlineweight(1);
zup3.hidebubble();

plot zdwn3 = if show_extra_atr_lines and open1 > 0 and low < (open1-(2*atr1)) then (open1-(3*atr1)) else na;
zdwn3.SetPaintingStrategy(PaintingStrategy.HORIZONTAL);
zdwn3.SetDefaultColor(Color.red);
#zdwn3.setlineweight(1);
zdwn3.hidebubble();

# atr4
plot zup4 = if show_extra_atr_lines and open1 > 0 and high > (open1+(3*atr1)) then (open1+(4*atr1)) else na;
zup4.SetPaintingStrategy(PaintingStrategy.HORIZONTAL);
zup4.SetDefaultColor(Color.green);
#zup4.setlineweight(1);
zup4.hidebubble();

plot zdwn4 = if show_extra_atr_lines and open1 > 0 and low < (open1-(3*atr1)) then (open1-(4*atr1)) else na;
zdwn4.SetPaintingStrategy(PaintingStrategy.HORIZONTAL);
zdwn4.SetDefaultColor(Color.red);
#zdwn4.setlineweight(1);
zdwn4.hidebubble();


#------------------------

input test_per = no;
addchartbubble(test_per, low,
atrper
, color.yellow, no);
#
This is brilliant @halcyonguy . Thank you very much for taking this and making it much more granular than I imagined.
I would love the option of being able to break this feature out on its own. For example, there would be a standalone input for "start of day ATR" In my case I would use the daily atr as the starting point of the day so the label will then reflect the % change as its approaching 1/-1 ATR from the open using the daily ATR. I mainly trade intraday, so this quickly gets the number to use for the rest of the session off the open.
This part doesn't change and is the magic and would still be attached to the second agg. The only other suggestions would be to add up to 6 atr's (or adjustable)
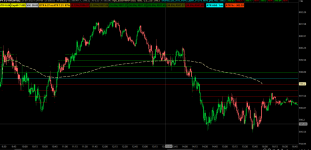
Another visual change would be if it were possible to create the lines so that they "connect" similar to this style:
In addition to making the lines continuous, would be great to have an option for futures so that an "eth" window can be defined. In this case it would start at 18:00 and and at 9:29am ET.
Keeping all the lines the same length and making them continuous would greatly improve the aesthetic.
Hi! - another edit would be to change the “ATR AGG” label to show the actual value of the ATR chosen for the second agg. In the case the 5m is used , the label would display “ATR 5m = “value”
useThinkScript is the #1 community of stock market investors using indicators and other tools to power their trading strategies. Traders of all skill levels use our forums to learn about scripting and indicators, help each other, and discover new ways to gain an edge in the markets.
How do I get started?
We get it. Our forum can be intimidating, if not overwhelming. With thousands of topics, tens of thousands of posts, our community has created an incredibly deep knowledge base for stock traders. No one can ever exhaust every resource provided on our site.
If you are new, or just looking for guidance, here are some helpful links to get you started.
VIP members get exclusive access to these proven and tested premium indicators: Buy the Dip, Advanced Market Moves 2.0, Take Profit, and Volatility Trading Range. In addition, VIP members get access to over 50 VIP-only custom indicators, add-ons, and strategies, private VIP-only forums, private Discord channel to discuss trades and strategies in real-time, customer support, trade alerts, and much more. Learn all about VIP membership here.
How can I access the premium indicators?
To access the premium indicators, which are plug and play ready, sign up for VIP membership here.