ATR Label for ThinkorSwim

roger80k

New member
Hi Guys if anyone has DTR VS ATR indicator and can post a script for TOS would really appreciate it.

Code:
#
# Copyright 2014 Scott J. Johnson (https://scottjjohnson.com)
#
# Licensed under the Apache License, Version 2.0 (the "License");
# you may not use this file except in compliance with the License.
# You may obtain a copy of the License at
#
#      http://www.apache.org/licenses/LICENSE-2.0
#
# Unless required by applicable law or agreed to in writing, software
# distributed under the License is distributed on an "AS-IS" BASIS,
# WITHOUT WARRANTIES OR CONDITIONS OF ANY KIND, either express or implied.
# See the License for the specific language governing permissions and
# limitations under the License.
#

#
# ATRLabel
#
# Displays Average True Range over the last 40 periods and the current period
#
input ATRLength = 40;

# historical ATR
def ATRValue = Average(TrueRange(high,  close,  low),  ATRLength);
def ATRPercent = ATRValue / close * 100;

# current period range
def ATRLastBar = TrueRange(high,  close,  low);

AddLabel(yes, ATRLength + " Period ATR = $" + Round(ATRValue, 2) + " (" + Round(ATRPercent, 2) + "%), Current Period Range = $" + Round(ATRLastBar, 2) + " (" + Round(ATRLastBar / close * 100, 2) + "%)", CreateColor(153, 153, 0));
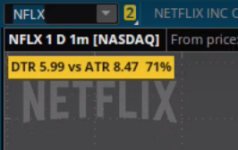
 
Solution
@roger80k Not exactly what you wanted but might work, Just combined two already existing studies and just gives you the labels.


Code:
input aggPeriod = AggregationPeriod.DAY;

input length = 20;

input multiplier = 2;


def studyPrice = close(period = aggPeriod);

def hi = high(period = aggPeriod);

def lo = low(period = aggPeriod);

def r = hi - lo;

def avgRange = Average(r, length);

def avg = Average(studyPrice, length);


AddLabel(yes, Concat("average daily range: ", avgRange), color.ORANGE);


# Average True Range Label


# Mobius


# V01.10.2013


input nATR = 21;


input SdPeriods = 252;


def AggD = AggregationPeriod.Day;


def hD = high(period = AggD);


def lD = low(period = AggD);


def cD = close(period =...

Join useThinkScript to post your question to a community of 21,000+ developers and traders.

ATR is already available in ThinkorSwim. I'm not sure about DTR but there is one called Average Daily Range posted here.

It looks like this

F8xjBdn.png
 

Attachments

  • F8xjBdn.png
    F8xjBdn.png
    62 KB · Views: 118
@roger80k If you have a picture of it, then it's on your system. Click the little beaker to look up the code. Please let us know what it is then, please!
 
Last edited:
@roger80k Not exactly what you wanted but might work, Just combined two already existing studies and just gives you the labels.


Code:
input aggPeriod = AggregationPeriod.DAY;

input length = 20;

input multiplier = 2;


def studyPrice = close(period = aggPeriod);

def hi = high(period = aggPeriod);

def lo = low(period = aggPeriod);

def r = hi - lo;

def avgRange = Average(r, length);

def avg = Average(studyPrice, length);


AddLabel(yes, Concat("average daily range: ", avgRange), color.ORANGE);


# Average True Range Label


# Mobius


# V01.10.2013


input nATR = 21;


input SdPeriods = 252;


def AggD = AggregationPeriod.Day;


def hD = high(period = AggD);


def lD = low(period = AggD);


def cD = close(period = AggD);


def TR = TrueRange(high, close, low);


def ATR = Average(TR, nATR);


def ATRd = Average(TrueRange(hD, cD, lD), nATR);


def SDatr = StDev(ATRd, SdPeriods);


def hhATR = highest(SDatr, SdPeriods);


def llATR = lowest(SDatr, SdPeriods);


def ATRpercentile = (SDatr - llATR) / (hhATR - llATR);


AddLabel(yes, "(Chart Agg. TR = $" +


               TR +


           " //  ATR Perids: " +


               nATR +


           " = $" +


              (Round(ATR / TickSize(), 0) * TickSize()) +


           ");  ATR Daily = $" +


              (Round(ATRd / TickSize(), 0) * TickSize()) +


          ";  ATR YR. Percentile: " +


              AsPercent(ATRpercentile),


              if ATR > ATR[1]


              then Color.Green


              else if ATR < ATR[1]


              then Color.Red


              else Color.White);
 
Last edited by a moderator:
Solution
@roger80k try this ATR label out for size.... DTR vs. ATR(5)
Code:
# TS ATR
# Made By Leonard
# Version 1
# 4/23/2015
# Copyright Leonard Tulko 2014 - 2015 All rights reserved
# This software is licensed for individual use only.
# Here is a label for the thinkorswim charts that will display what the atr is and also display the day trade range based of the high – the low
# http://tradingsmart.net/indicators/average-true-range-label/

declare upper;

input ATRLength = 5;
input averagetype = AverageType.WILDERS;
input BasePeriod = AggregationPeriod.DAY;
input showlabel = yes;

def ATR = MovingAverage (averagetype, TrueRange(high(period = BasePeriod)[1], close(period = BasePeriod)[1], low(period = BasePeriod)[1]), ATRLength);

def Today_High = Highest(high(period = baseperiod)[0], 1);
def Today_Low = Lowest(low(period =baseperiod)[0], 1);

def DR = Today_High - Today_Low;

AddLabel(showlabel, "DTR: " + Round(DR , 2) + " vs. ATR(5):" +round(ATR,2), Color.LIGHT_GRAY);
 
I'm not sure if anyone has posted something like this before but I've looked around and never found it (and until today I couldn't figure out how to code it) ....so here it is.

As recommended by the NNFX plan, here's a little script (thanks to some modifications to a script posted by @scottrades
back in January) that will display on the top left of the chart what the current rolling (candle to candle) ATR value is without having the ATR indicator taking up an indicator slot. Default is 1Min, but change the AggPeriod if you scalp from a different time frame and want to know the ATR (14) avg of the current candle.

Code:
# ATR_Rolling_Label
# For anyone (scalpers) wanting to know what the current rolling
# (candle to candle) ATR value is without having the
# ATR indicator taking up screen real estate.  Change the AggPeriod if
# you scalp from a different time frame.

# ------ START CODE

input ATRPeriod = 14;
input period = AggregationPeriod.MIN;
def ATR = MovingAverage(AverageType.WILDERS, TrueRange(high(period = period), close(period = period), low(period = period)), ATRperiod);
def showATRalways = yes;

def currATR = Round((high(period = AggregationPeriod.DAY) - low(period = AggregationPeriod.DAY)),2);
AddLabel(showATRalways, "Rolling ATR: " + Round(ATR,2), color.green);

# ------- END CODE

Shared script file is here: tos.mx/sz7tXKC

bZoK8oL.jpg
 
Last edited by a moderator:
Hey All, I have a script that provides me with the current candle-to-candle ATR of an instrument (code below). Is there a way to use this code to change the color of the candle in real time when it exceeds this current ATR? If my other indicators are saying 'go long' but the candle that this happens on has already exceeded ATR I don't necessarily want to enter on the very next candle. Thanks!!

Code:
# ATR_Rolling_Label
# For anyone (scalpers) wanting to know what the current rolling
# (candle to candle) ATR value is without having the
# ATR lower indicator taking up screen real estate.  Set to 1 min Agg.
# Change the AggPeriod if  you scalp from a different time frame.

# ------ START CODE

input ATRPeriod = 14;
input period = AggregationPeriod.MIN;
def ATR = MovingAverage(AverageType.WILDERS, TrueRange(high(period = period), close(period = period), low(period = period)), ATRperiod);
def showATRalways = yes;

def currATR = Round((high(period = AggregationPeriod.DAY) - low(period = AggregationPeriod.DAY)),2);
AddLabel(showATRalways, "Rolling ATR: " + Round(ATR,2), color.green);

# ------- END CODE
 
@RickKennedy,

You might try something like this:
Code:
AddLabel(showATRalways, "Rolling ATR: " + Round(ATR,3), color.dark_green);
addLabel(showATRalways, "ATR[1]: " + Round(Atr[1], 3), if ATR > Atr[1] then color.dark_red else color.blue);
AssignPriceColor(if ATR > ATR[1] then Color.MAGENTA else color.black);

I use a light background, so obviously color.black will do you no favours if you are using a black background, but it will make the magenta candles 'pop'. :p

I put in the additional label for ATR[1] as a sanity check. And I set rounding at 3 places, again as a sanity check.

This may, or may not, be what you were intending.

-mashume
 
That's really close! Thanks @mashume !.... I made a mod to the "ATR > ATR[1] line so that only candles of a certain magnitude (arbitrarily 1.10) get highlighted and not just ones that exceed the size of the previous candle's ATR (see below). Because I use a dark screen, I chose the the 'then' color to be yellow and the 'else' color (temporarily) to be white, but how would I change that last part so that the candles are always normal colors (red:down/green:up) unless they're yellow due to the surge?

Thanks again!

Code:
# ------ START CODE

input ATRPeriod = 14;
input period = AggregationPeriod.MIN;
def ATR = MovingAverage(AverageType.WILDERS, TrueRange(high(period = period), close(period = period), low(period = period)), ATRperiod);
def showATRalways = yes;

def currATR = Round((high(period = AggregationPeriod.DAY) - low(period = AggregationPeriod.DAY)),2);
AddLabel(showATRalways, "Rolling ATR: " + Round(ATR,4), color.green);

AddLabel(showATRalways, "ATR[1]: " + Round(ATR[1], 4), if ATR > ATR[1] then color.dark_green else color.dark_red);
AssignPriceColor(if ATR > ATR[1]*1.10 then Color.yellow else color.white);

# ------- END CODE
 
I was wondering if there's a way to get the average ATR value of the first 30 min bars ONLY.
Example: I choose to have the average ATR value of the last 30 30-min bars, so the indicator will get the ATR value of the first 30 min bar of each of the 30 days and divide it by 30. Is there a way to get it? Any help will be greatly appreciated, thank you in advance, have a great day.

Try this study on a 30m, 30 day chart. Its not perfect, but may be close enough.

Jay

Code:
Input DaysAgo = 30;#hint DaysAgo: Excludes today

def  AdjDaysAgo = DaysAgo + 1;   #Adjusted to match a true LastDate which includes today

def day = GetDay();
def lastDay = GetLastDay();
def year = GetYear();
def lastYear = GetLastYear();
def yyyymmdd = GetYYYYMMDD();
def lastDate = HighestAll( if day == lastDay and year == lastYear then yyyymmdd else Double.NaN );
def currentDate = if yyyymmdd < lastDate then yyyymmdd else lastDate;
def targetDayRange = if CountTradingDays( currentDate, lastDate ) <= AdjDaysAgo then yes else no;

input startTime = 930;
input endTime = 1000;

def targetWindow = targetDayRange and secondsTillTime(startTime) <= 0 and secondsTillTime(endTime) > 0;

def countAll = if targetWindow then countAll[1] + 1 else countAll[1];
def sumAll = if targetWindow then sumAll[1] + TrueRange(high, close, low) else sumAll[1];

AddLabel(yes, "Count:" + countAll + " Avg: " + (sumAll / countAll), Color.CYAN);
 
This is the label code I use. If you want to plot just change def to plot.

Code:
input addBlackSpacer = yes;
AddLabel(addBlackSpacer, "  ", Color.BLACK);

input lookback = 1;
input ATR_Target = 1.50;
input pbATRLength = 1;
input Show_Labels = yes;
input Show_TargetLabels = no;
input Show_ATRvalue = yes;

input length = 5;
input averageType = AverageType.WILDERS;

def ATR = MovingAverage(averageType, TrueRange(high, close, low), length);
AddLabel(Show_Labels, Concat("ATR  @ ", ATR[1]), Color.WHITE);

AddLabel(ATR_Target, "  *  " +ATR_Target, Color.White);
AddLabel(Yes, "=", Color.White);

def vATR =  (ATR * ATR_Target);
AddLabel(Show_ATRvalue, Concat("ATR Value @ $", vATR), Color.LIME);

#def ATR_TickValue =  (ATR * ATR_Target/tickSize());

#def ATR_Value =  (ATR_TickValue * tickValue());
#AddLabel(Show_ATRvalue, Concat("ATR Value @ $", ATR_Value), Color.LIME);

#def ATR_Price = (ATR_Value/close);
#AddLabel(Show_Labels, Concat("ATR Value:Price  @ ", aspercent(ATR_Price)), Color.WHITE);


###################################################################################
#Percentile
def vol = ATR;
input DisplayATRPercentile = yes;

input TimePeriod = 250;
 
def data = if !isNaN(vol) then vol else vol[-1];
def hi = highest(data, TimePeriod);
def lo = lowest(data, TimePeriod);
def Percentile = (data - lo) / (hi - lo) * 100;
def lowend = Percentile < 20;
def highend = Percentile > 80;
#####################################################################################
addlabel(DisplayATRPercentile , concat("ATR Pct Rank: ",aspercent(Percentile /100)), if lowend then color.CYAN else if highend then color.PLUM else Color.GRAY);
#####################################################################################

#Targets
AddLabel(Show_TargetLabels, "Profit Target = +" +ATR[1] * ATR_Target+ "", color.GREEN);
#AddLabel(Show_TargetLabels, " : Stop Loss =  -" +ATR * 1.0+ "", color.PINK);
#AddLabel(Show_TargetLabels, " : ATR daily = " +ATR+ "", color.GRAY);
 

Similar threads

Not the exact question you're looking for?

Start a new thread and receive assistance from our community.

87k+ Posts
512 Online
Create Post

Similar threads

Similar threads

The Market Trading Game Changer

Join 2,500+ subscribers inside the useThinkScript VIP Membership Club
  • Exclusive indicators
  • Proven strategies & setups
  • Private Discord community
  • ‘Buy The Dip’ signal alerts
  • Exclusive members-only content
  • Add-ons and resources
  • 1 full year of unlimited support

Frequently Asked Questions

What is useThinkScript?

useThinkScript is the #1 community of stock market investors using indicators and other tools to power their trading strategies. Traders of all skill levels use our forums to learn about scripting and indicators, help each other, and discover new ways to gain an edge in the markets.

How do I get started?

We get it. Our forum can be intimidating, if not overwhelming. With thousands of topics, tens of thousands of posts, our community has created an incredibly deep knowledge base for stock traders. No one can ever exhaust every resource provided on our site.

If you are new, or just looking for guidance, here are some helpful links to get you started.

What are the benefits of VIP Membership?
VIP members get exclusive access to these proven and tested premium indicators: Buy the Dip, Advanced Market Moves 2.0, Take Profit, and Volatility Trading Range. In addition, VIP members get access to over 50 VIP-only custom indicators, add-ons, and strategies, private VIP-only forums, private Discord channel to discuss trades and strategies in real-time, customer support, trade alerts, and much more. Learn all about VIP membership here.
How can I access the premium indicators?
To access the premium indicators, which are plug and play ready, sign up for VIP membership here.
Back
Top