
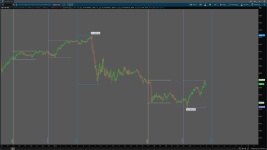
I been trying to get at asia session line to move to 21:59 but it doesnt work. Does any one know why thats hapening. London and New york i was able to move them just not Asia. The code is below.
Code:
declare hide_on_daily;

input display_last_zone = yes;
input display_count = 2;
input Show_Cloud = no;
input Show_Cloud2 = no;
input Show_Vertical_Line = yes;


###############################################

###############################################


#############################################################################################################
#############################################################################################################

#Q1
def Asian_Q1_afterbegin = 2000;
def Asian_Q1_afterend = 0000;
def Asian_Q1_aftermarket = SecondsFromTime(Asian_Q1_afterbegin) >= 0 and SecondsFromTime(Asian_Q1_afterend) >= 0;
def Asian_Q1_bars = 2000;

def Asian_DrawLine =
!SecondsFromTime(2000)[1];


#input Asian_Q1_pricePerRowHeightMode = { AUTOMATIC, default TICKSIZE, CUSTOM};
input Asian_Q1_pricePerRowHeightMode = { TICKSIZE, default AUTOMATIC, CUSTOM};

def Asian_Q1_customRowHeight = 1.0;
input Asian_Q1_timePerProfile = {default BAR};
def Asian_Q1_onExpansion = no;
def Asian_Q1_profiles = 1000;

def Asian_Q1_period;

switch (Asian_Q1_timePerProfile) {
case BAR:
Asian_Q1_period = BarNumber() - 1;
}


def Asian_Q1_count = CompoundValue(1, if Asian_Q1_aftermarket and Asian_Q1_period != Asian_Q1_period[1] then (Asian_Q1_count[1] + Asian_Q1_period - Asian_Q1_period[1]) % Asian_Q1_bars else Asian_Q1_count[1], 0);
def Asian_Q1_cond = Asian_Q1_count < Asian_Q1_count[1] + Asian_Q1_period - Asian_Q1_period[1];
def Asian_Q1_height;
switch (Asian_Q1_pricePerRowHeightMode) {
case AUTOMATIC:
Asian_Q1_height = PricePerRow.AUTOMATIC;
case TICKSIZE:
Asian_Q1_height = PricePerRow.TICKSIZE;
case CUSTOM:
Asian_Q1_height = Asian_Q1_customRowHeight;
}

profile Asian_Q1_vol = VolumeProfile("startNewProfile" = Asian_Q1_cond, "onExpansion" = no, "numberOfProfiles" = 1000, "pricePerRow" = Asian_Q1_height, "value area percent" = 0);

def Asian_Q1_con = CompoundValue(1, Asian_Q1_onExpansion, no);

def Asian_Q1_hProfile = if Asian_Q1_aftermarket and IsNaN(Asian_Q1_vol.GetHighest()) and Asian_Q1_con then Asian_Q1_hProfile[1] else Asian_Q1_vol.GetHighest();
def Asian_Q1_lProfile = if Asian_Q1_aftermarket and IsNaN(Asian_Q1_vol.GetLowest()) and Asian_Q1_con then Asian_Q1_lProfile[1] else Asian_Q1_vol.GetLowest();
def Asian_Q1_plotsDomain = IsNaN(close) == Asian_Q1_onExpansion;
def Asian_Q1_ProfileHigh = if Asian_Q1_aftermarket and Asian_Q1_plotsDomain then Asian_Q1_hProfile else Double.NaN;
def Asian_Q1_ProfileLow = if Asian_Q1_aftermarket and Asian_Q1_plotsDomain then Asian_Q1_lProfile else Double.NaN;

def basis = if TickSize() > .01 then GetYYYYMMDD() else GetDay();
def asiancount = if basis != basis[1] then asiancount[1] + 1 else asiancount[1];
def asiancond = HighestAll(asiancount) - asiancount + 1;
AddVerticalLine (if Show_Vertical_Line and asiancond <= display_count then Asian_DrawLine else Double.NaN, "Asian", CreateColor(204, 255, 204), Curve.FIRM);

plot Asian_Q1_hrange = if display_last_zone and asiancond > display_count then Double.NaN else Asian_Q1_ProfileHigh;
plot Asian_Q1_lrange = if display_last_zone and asiancond > display_count then Double.NaN else Asian_Q1_ProfileLow;
Asian_Q1_hrange.SetPaintingStrategy(PaintingStrategy.HORIZONTAL);
Asian_Q1_lrange.SetPaintingStrategy(PaintingStrategy.HORIZONTAL);
Asian_Q1_hrange.SetDefaultColor(CreateColor(204, 255, 204));
Asian_Q1_lrange.SetDefaultColor(CreateColor(204, 255, 204));
Asian_Q1_hrange.SetLineWeight(1);
Asian_Q1_lrange.SetLineWeight(1);
#Asian_Q1_hrange.Hide();
#Asian_Q1_lrange.Hide();

def Asian_Q1_bubblemover = 0;
def Asian_Q1_b = Asian_Q1_bubblemover;
def Asian_Q1_b1 = Asian_Q1_b + 1;


input Asian_Q1_showbubbles = no;
AddChartBubble(Asian_Q1_showbubbles and (IsNaN(Asian_Q1_hrange[Asian_Q1_b1]) and Asian_Q1_hrange[Asian_Q1_b]) , Asian_Q1_hrange, AsText(Asian_Q1_hrange), Color.LIGHT_RED);

AddChartBubble(Asian_Q1_showbubbles and (IsNaN(Asian_Q1_hrange[Asian_Q1_b1]) and Asian_Q1_hrange[Asian_Q1_b]) , Asian_Q1_lrange, AsText(Asian_Q1_lrange), Color.LIGHT_GREEN, up = no);

input Asian_Q1_showverticalline = no;
AddVerticalLine(Asian_Q1_showverticalline and Asian_Q1_hrange != Asian_Q1_hrange[1], "", Color.BLUE, stroke = Curve.FIRM);


#Addcloud(hrange, lrange, createcolor(0, 51, 51), createcolor(0, 51, 51));
AddCloud(if Show_Cloud then Asian_Q1_hrange else Double.NaN, Asian_Q1_lrange, CreateColor(204, 255, 204), CreateColor(204, 255, 204));

AddCloud(if Show_Cloud2 then Asian_Q1_hrange else Double.NaN, Asian_Q1_lrange, Color.BLACK, Color.BLACK);

#Addcloud(Asian_Q1_hrange, Asian_Q1_lrange, color.black, color.black);


###############################################################
###############################################################
###############################################################
#LONDON


def London_Q2_afterbegin = 0200;
def London_Q2_afterend = 0559;
def London_Q2_aftermarket = SecondsFromTime(London_Q2_afterbegin) >= 0 and SecondsTillTime(London_Q2_afterend) >= 0;
def London_Q2_bars = 2000;

def London_DrawLine =
!SecondsFromTime(0200)[1];


#input London_Q2_pricePerRowHeightMode = { AUTOMATIC, default TICKSIZE, CUSTOM};
input London_Q2_pricePerRowHeightMode = { TICKSIZE, default AUTOMATIC, CUSTOM};

def London_Q2_customRowHeight = 1.0;
input London_Q2_timePerProfile = {default BAR};
def London_Q2_onExpansion = no;
def London_Q2_profiles = 1000;

def London_Q2_period;

switch (London_Q2_timePerProfile) {
case BAR:
London_Q2_period = BarNumber() - 1;
}


def London_Q2_count = CompoundValue(1, if London_Q2_aftermarket and London_Q2_period != London_Q2_period[1] then (London_Q2_count[1] + London_Q2_period - London_Q2_period[1]) % London_Q2_bars else London_Q2_count[1], 0);
def London_Q2_cond = London_Q2_count < London_Q2_count[1] + London_Q2_period - London_Q2_period[1];
def London_Q2_height;
switch (London_Q2_pricePerRowHeightMode) {
case AUTOMATIC:
London_Q2_height = PricePerRow.AUTOMATIC;
case TICKSIZE:
London_Q2_height = PricePerRow.TICKSIZE;
case CUSTOM:
London_Q2_height = London_Q2_customRowHeight;
}

profile London_Q2_vol = VolumeProfile("startNewProfile" = London_Q2_cond, "onExpansion" = no, "numberOfProfiles" = 1000, "pricePerRow" = London_Q2_height, "value area percent" = 0);

def London_Q2_con = CompoundValue(1, London_Q2_onExpansion, no);

def London_Q2_hProfile = if London_Q2_aftermarket and IsNaN(London_Q2_vol.GetHighest()) and London_Q2_con then London_Q2_hProfile[1] else London_Q2_vol.GetHighest();
def London_Q2_lProfile = if London_Q2_aftermarket and IsNaN(London_Q2_vol.GetLowest()) and London_Q2_con then London_Q2_lProfile[1] else London_Q2_vol.GetLowest();
def London_Q2_plotsDomain = IsNaN(close) == London_Q2_onExpansion;
def London_Q2_ProfileHigh = if London_Q2_aftermarket and London_Q2_plotsDomain then London_Q2_hProfile else Double.NaN;
def London_Q2_ProfileLow = if London_Q2_aftermarket and London_Q2_plotsDomain then London_Q2_lProfile else Double.NaN;

def londoncount = if basis != basis[1] then londoncount[1] + 1 else londoncount[1];
def londoncond = HighestAll(londoncount) - londoncount + 1;
AddVerticalLine (if Show_Vertical_Line and londoncond <= display_count then London_DrawLine else Double.NaN, "London", CreateColor(153, 153 , 255), Curve.FIRM);

plot London_Q2_hrange = if display_last_zone and londoncond > display_count then Double.NaN else London_Q2_ProfileHigh;
plot London_Q2_lrange = if display_last_zone and londoncond > display_count then Double.NaN else London_Q2_ProfileLow;
London_Q2_hrange.SetPaintingStrategy(PaintingStrategy.HORIZONTAL);
London_Q2_lrange.SetPaintingStrategy(PaintingStrategy.HORIZONTAL);
London_Q2_hrange.SetDefaultColor(CreateColor(153, 153 , 255));
London_Q2_lrange.SetDefaultColor(CreateColor(153, 153 , 255));
London_Q2_hrange.SetLineWeight(1);
London_Q2_lrange.SetLineWeight(1);
#London_Q2_hrange.Hide();
#London_Q2_lrange.Hide();

def London_Q2_bubblemover = 0;
def London_Q2_b = London_Q2_bubblemover;
def London_Q2_b1 = London_Q2_b + 1;


input London_Q2_showbubbles = no;
AddChartBubble(London_Q2_showbubbles and (IsNaN(London_Q2_hrange[London_Q2_b1]) and London_Q2_hrange[London_Q2_b]) , London_Q2_hrange, AsText(London_Q2_hrange), Color.LIGHT_RED);

AddChartBubble(London_Q2_showbubbles and (IsNaN(London_Q2_hrange[London_Q2_b1]) and London_Q2_hrange[London_Q2_b]) , London_Q2_lrange, AsText(London_Q2_lrange), Color.LIGHT_GREEN, up = no);

input London_Q2_showverticalline = yes;
AddVerticalLine(London_Q2_showverticalline and London_Q2_hrange != London_Q2_hrange[1], "London ", Color.BLUE, stroke = Curve.FIRM);

#Addcloud(hrange, lrange, createcolor(0, 51, 51), createcolor(0, 51, 51));
AddCloud(if Show_Cloud then London_Q2_hrange else Double.NaN, London_Q2_lrange, CreateColor(153, 153 , 255), CreateColor(153, 153 , 255));

AddCloud(if Show_Cloud2 then London_Q2_hrange else Double.NaN, London_Q2_lrange, Color.BLACK, Color.BLACK);


#Addcloud(London_Q2_hrange, London_Q2_lrange, color.black, color.black);

#############################################################################################################
#############################################################################################################

#############################################################################################################
#############################################################################################################
def NY_DrawLine =
#GetDay() == GetLastDay() and
(
!SecondsFromTime(0700)
);

#AddVerticalLine (DrawLine, "", Color.Dark_black,Curve.Long_DASH);


def Show_last = if GetDay() == GetLastDay() then 1 else 0;

#############################################################################################################
#############################################################################################################

#Q3
def NY_Q3_afterbegin = 0700;
def NY_Q3_afterend = 1059;
def NY_Q3_aftermarket = SecondsFromTime(NY_Q3_afterbegin) >= 0 and SecondsTillTime(NY_Q3_afterend) >= 0;
def NY_Q3_bars = 2000;

#input NY_Q3_pricePerRowHeightMode = { AUTOMATIC, default TICKSIZE, CUSTOM};
input NY_Q3_pricePerRowHeightMode = { TICKSIZE, default AUTOMATIC, CUSTOM};

def NY_Q3_customRowHeight = 1.0;
input NY_Q3_timePerProfile = {default BAR};
def NY_Q3_onExpansion = no;
def NY_Q3_profiles = 1000;

def NY_Q3_period;

switch (NY_Q3_timePerProfile) {
case BAR:
NY_Q3_period = BarNumber() - 1;
}


def NY_Q3_count = CompoundValue(1, if NY_Q3_aftermarket and NY_Q3_period != NY_Q3_period[1] then (NY_Q3_count[1] + NY_Q3_period - NY_Q3_period[1]) % NY_Q3_bars else NY_Q3_count[1], 0);
def NY_Q3_cond = NY_Q3_count < NY_Q3_count[1] + NY_Q3_period - NY_Q3_period[1];
def NY_Q3_height;
switch (NY_Q3_pricePerRowHeightMode) {
case AUTOMATIC:
NY_Q3_height = PricePerRow.AUTOMATIC;
case TICKSIZE:
NY_Q3_height = PricePerRow.TICKSIZE;
case CUSTOM:
NY_Q3_height = NY_Q3_customRowHeight;
}

profile NY_Q3_vol = VolumeProfile("startNewProfile" = NY_Q3_cond, "onExpansion" = no, "numberOfProfiles" = 1000, "pricePerRow" = NY_Q3_height, "value area percent" = 0);

def NY_Q3_con = CompoundValue(1, NY_Q3_onExpansion, no);

def NY_Q3_hProfile = if NY_Q3_aftermarket and IsNaN(NY_Q3_vol.GetHighest()) and NY_Q3_con then NY_Q3_hProfile[1] else NY_Q3_vol.GetHighest();
def NY_Q3_lProfile = if NY_Q3_aftermarket and IsNaN(NY_Q3_vol.GetLowest()) and NY_Q3_con then NY_Q3_lProfile[1] else NY_Q3_vol.GetLowest();
def NY_Q3_plotsDomain = IsNaN(close) == NY_Q3_onExpansion;
def NY_Q3_ProfileHigh = if NY_Q3_aftermarket and NY_Q3_plotsDomain then NY_Q3_hProfile else Double.NaN;
def NY_Q3_ProfileLow = if NY_Q3_aftermarket and NY_Q3_plotsDomain then NY_Q3_lProfile else Double.NaN;

def nyq3count = if basis != basis[1] then nyq3count[1] + 1 else nyq3count[1];
def nyq3cond = HighestAll(nyq3count) - nyq3count + 1;
AddVerticalLine (if Show_Vertical_Line and nyq3cond <= display_count then NY_DrawLine else Double.NaN, "NY AM", CreateColor(0, 153, 255), Curve.FIRM);

plot NY_Q3_hrange = if display_last_zone and nyq3cond > display_count then Double.NaN else NY_Q3_ProfileHigh;
plot NY_Q3_lrange = if display_last_zone and nyq3cond > display_count then Double.NaN else NY_Q3_ProfileLow;
NY_Q3_hrange.SetPaintingStrategy(PaintingStrategy.HORIZONTAL);
NY_Q3_lrange.SetPaintingStrategy(PaintingStrategy.HORIZONTAL);
NY_Q3_hrange.SetDefaultColor(CreateColor(0, 153, 255));
NY_Q3_lrange.SetDefaultColor(CreateColor(0, 153, 255));
NY_Q3_hrange.SetLineWeight(1);
NY_Q3_lrange.SetLineWeight(1);
#NY_Q3_hrange.Hide();
#NY_Q3_lrange.Hide();

def NY_Q3_bubblemover = 0;
def NY_Q3_b = NY_Q3_bubblemover;
def NY_Q3_b1 = NY_Q3_b + 1;


input NY_Q3_showbubbles = no;
AddChartBubble(NY_Q3_showbubbles and (IsNaN(NY_Q3_hrange[NY_Q3_b1]) and NY_Q3_hrange[NY_Q3_b]) , NY_Q3_hrange, AsText(NY_Q3_hrange), Color.LIGHT_RED);

AddChartBubble(NY_Q3_showbubbles and (IsNaN(NY_Q3_hrange[NY_Q3_b1]) and NY_Q3_hrange[NY_Q3_b]) , NY_Q3_lrange, AsText(NY_Q3_lrange), Color.LIGHT_GREEN, up = no);

input NY_Q3_showverticalline = no;
AddVerticalLine(NY_Q3_showverticalline and NY_Q3_hrange != NY_Q3_hrange[1], "", Color.BLUE, stroke = Curve.FIRM);

#Addcloud(hrange, lrange, createcolor(0, 51, 51), createcolor(0, 51, 51));
AddCloud(if Show_Cloud then NY_Q3_hrange else Double.NaN, NY_Q3_lrange, CreateColor(0, 153, 255), CreateColor(0, 153, 255));

AddCloud(if Show_Cloud2 then NY_Q3_hrange else Double.NaN, NY_Q3_lrange, Color.BLACK, Color.BLACK);

#Addcloud(NY_Q3_hrange, NY_Q3_lrange, color.black, color.black);

#############################################################################################################
#############################################################################################################
Attachments
Last edited by a moderator: