Repaints AsGoodAsItGets Day Trading Chart Set-up For ThinkOrSwim

Repaints

csricksdds

Trader Educator
VIP
5/2/23 New Lower Chart Version: https://usethinkscript.com/threads/...art-set-up-for-thinkorswim.13902/#post-124715

mod note: This is a repainting indicator:
https://usethinkscript.com/threads/answers-to-commonly-asked-questions.6006/#post-57833

16975[/ATTACH]']
qEauH4J.png

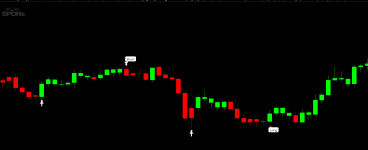
This is what my chart looks like. These are the Indicators: The pivot points and arrows are offset so if they line up means probable trend reversal - if they line up with the short/long is probable trend bingo?

AsGood_HighLow_TurningPointArrows:
Ruby:
##AsGood_HighLowPointPivot_Arrows
def bn = BarNumber();
def na = double.nan;

input length = 7;
def lastBar = HighestAll(if IsNaN(close) then 0 else bn);
def offset = Min(length - 1, lastBar - bn);

input ignore_last_bar = yes;
def ignorelast = if (ignore_last_bar and bn == lastbar) then 0 else 1;

def HighPoint = ignorelast and high > highest(high[1], length - 1) and high == GetValue(highest(high, length), -offset);
def Lowpoint = ignorelast and low < Lowest(low[1], length - 1) and low == GetValue(Lowest(low, length), -offset);


input show_Arrows_on_Highpoints_Lowpoints = yes;
def vert = 0.001;

def prange = highPoint – lowPoint;
def plotHighest = highpoint + prange * .3;
def plotLowest = lowpoint - prange * 3.0;

plot BuyCriteria = if LowPoint then Low else double.NaN ;
plot SellCriteria = if HighPoint then High else double.NaN ;

BuyCriteria.SetPaintingStrategy(PaintingStrategy.ARROW_UP) ;
BuyCriteria.SetDefaultColor(color.WHITE);
BuyCriteria.SetLineWeight(5);
SellCriteria.SetPaintingStrategy(PaintingStrategy.ARROW_DOWN) ;
SellCriteria.SetDefaultColor(color.WHITE);
SellCriteria.SetLineWeight(5);

AGood_TopsBottoms
# Tops \ Bottoms
# Mobius modified
# Modified C.Ricks 12/22/22

input Percent_A_to_C = .1;
input nP = 13;


def AC = Percent_A_to_C / 100;
def h = high;
def l = low;
def bar = BarNumber();
def Ps = 1 + AC;
def Ns = 1 - AC;

def hh = fold j = 1 to nP + 1
with q = 1
while q
do h > GetValue(h, -j);

def PivotH = if (bar > nP and
h == Highest(h, nP) and
hh)
then h
else Double.NaN;

def PH1 = if !isNaN(PivotH)
then h
else PH1[1];

def PH2 = if PH1 != PH1[1]
then PH1[1]
else PH2[1];

def CheckH1 = if between(PH2, PH1 * Ns, PH1 * Ps)
then 1
else 0;

plot PivotHDot = PivotH;
PivotHDot.SetDefaultColor(Color.WHITE);
PivotHDot.SetPaintingStrategy(PaintingStrategy.POINTS);


# Double Bottom

def ll = fold jl = 1 to nP + 1
with ql = 1
while ql
do l < GetValue(low, -jl);

def PivotL = if (bar > nP and
l == Lowest(l, nP) and
ll)
then l
else Double.NaN;

def PL1 = if !isNaN(PivotL)
then l
else PL1[1];

def PL2 = if PL1 != PL1[1]
then PL1[1]
else PL2[1];

def Check1 = if between(PL2, PL1 * Ns, PL1 * Ps)
then 1
else 0;


plot PivotLDot = PivotL;
PivotLDot.SetDefaultColor(Color.White);
PivotLDot.SetPaintingStrategy(PaintingStrategy.POINTS);

# End Code


AsGoodAsItGets_NoArrows (this is with no arrows so as not to compete with above indicators)

# AsGoodAsItGets Indicator without Arrows
#CSR Buy/Sell Arrows with Short/Long Bubbles
#Developed 4-9-22 First Edition 8-23-22 Revised
#No Arrow Edition 1/1/23

declare upper;

input atrreversal = 2.0;

def priceh = MovingAverage(AverageType.EXPONENTIAL, high, 5);
def pricel = MovingAverage(AverageType.EXPONENTIAL, low, 5);

def EIL = ZigZagHighLow("price h" = priceh, "price l" = pricel, "percentage reversal" = .01, "absolute reversal" = .05, "atr length" = 5, "atr reversal" = atrreversal).lastL;
def EIH = ZigZagHighLow("price h" = priceh, "price l" = pricel, "percentage reversal" = .01, "absolute reversal" = .05, "atr length" = 5, "atr reversal" = atrreversal).lastH;

plot signaldown = !isNAN(EIH);

AddChartBubble(SignalDown, high+.05, "Short", Color.white, yes);

plot signalrevBot = !isNaN(EIL);

AddChartBubble(Signalrevbot, low-.08, "Long", Color.white
, no);

input usealerts = yes;
alert(usealerts and signaldown[1] == 1, "Short", alert.bar, sound.ring);
alert(usealerts and signalrevbot[1] == 1, "Long", alert.bar, sound.ring);

AsGoodTrendColorCandles_MTFs
###This ASGoodTrendColorCandles_MTFs Indicator looks back 6 periods on each time frame divided by .5 painting the candle trend Green or Red. I use this as continued verification for my AsGoodAsItGets Long/Short Buy/Sell Indicator since it might repaint and I'm looking for further trend verification.
###Inspiration for this from the TTM_Trend Indicator which is a free indicator on TOS but doesn't provide code.
###Charles Ricks v.1 10/31/22 This indicator automatically address most time frames.

input AGP0 = AggregationPeriod.Min;
input AGP = AggregationPeriod.Five_Min;
input AGP1 = AggregationPeriod.Fifteen_Min;
input AGP2 = AggregationPeriod.Thirty_Min;
input AGP3 = AggregationPeriod.Hour;
input AGP4H = AggregationPeriod.FOUR_Hours;
input AGP4 = AggregationPeriod.DAY;
input AGP5 = AggregationPeriod.Week;
input AGP6 = AggregationPeriod.Month;
input TrendPeriods = 6;

def OP = open(period = AGP);
def HI = high(period = AGP);
def LOW = low(period = AGP);
def Close = close(period = AGP);
def HighestHigh = highest(HI, trendPeriods);
def LowestLow = lowest(LOW, trendPeriods);
def CandleTrend = if ((Close - LowestLow) / (HighestHigh - LowestLow)) > .5
then 1
else 0;

AssignPriceColor(if CandleTrend then color.green else color.red);
def OP0 = open(period = AGP0);
def HI0 = high(period = AGP0);
def LOW0 = low(period = AGP0);
def Close0 = close(period = AGP0);
def HighestHigh0 = highest(HI, trendPeriods);
def LowestLow0 = lowest(LOW, trendPeriods);
def trend0 = if ((Close - LowestLow) / (HighestHigh - LowestLow)) > .5
then 1
else 0;

AssignPriceColor(if CandleTrend then color.green else color.red);
def OP1 = open(period = AGP1);
def HI1 = high(period = AGP1);
def LOW1 = low(period = AGP1);
def Close1 = close(period = AGP1);
def HighestHigh1 = highest(HI, trendPeriods);
def LowestLow1 = lowest(LOW, trendPeriods);
def trend1 = if ((Close - LowestLow) / (HighestHigh - LowestLow)) > .5
then 1
else 0;

AssignPriceColor(if CandleTrend then color.green else color.red);
def OP2 = open(period = AGP2);
def HI2 = high(period = AGP2);
def LOW2 = low(period = AGP2);
def Close2 = close(period = AGP2);
def HighestHigh2 = highest(HI, trendPeriods);
def LowestLow2 = lowest(LOW, trendPeriods);
def trend2 = if ((Close - LowestLow) / (HighestHigh - LowestLow)) > .5
then 1
else 0;

AssignPriceColor(if CandleTrend then color.green else color.red);
def OP3 = open(period = AGP3);
def HI3 = high(period = AGP3);
def LOW3 = low(period = AGP3);
def Close3 = close(period = AGP3);
def HighestHigh3 = highest(HI, trendPeriods);
def LowestLow3 = lowest(LOW, trendPeriods);
def trend3 = if ((Close - LowestLow) / (HighestHigh - LowestLow)) > .5
then 1
else 0;

AssignPriceColor(if CandleTrend then color.green else color.red);
def OP4 = open(period = AGP4);
def HI4 = high(period = AGP4);
def LOW4 = low(period = AGP4);
def Close4 = close(period = AGP4);
def HighestHigh4 = highest(HI, trendPeriods);
def LowestLow4 = lowest(LOW, trendPeriods);
def trend4 = if ((Close - LowestLow) / (HighestHigh - LowestLow)) > .5
then 1
else 0;

AssignPriceColor(if CandleTrend then color.green else color.red);
def OP4H = open(period = AGP4H);
def HI4H = high(period = AGP4H);
def LOW4H = low(period = AGP4H);
def Close4H = close(period = AGP4H);
def HighestHigh4H = highest(HI, trendPeriods);
def LowestLow4H = lowest(LOW, trendPeriods);
def trend4H = if ((Close - LowestLow) / (HighestHigh - LowestLow)) > .5
then 1
else 0;

AssignPriceColor(if CandleTrend then color.green else color.red);
def OP5 = open(period = AGP5);
def HI5 = high(period = AGP5);
def LOW5 = low(period = AGP5);
def Close5 = close(period = AGP5);
def HighestHigh5 = highest(HI, trendPeriods);
def LowestLow5 = lowest(LOW, trendPeriods);
def trend5 = if ((Close - LowestLow) / (HighestHigh - LowestLow)) > .5
then 1
else 0;

AssignPriceColor(if CandleTrend then color.green else color.red);
def OP6 = open(period = AGP6);
def HI6 = high(period = AGP6);
def LOW6 = low(period = AGP6);
def Close6 = close(period = AGP6);
def HighestHigh6 = highest(HI, trendPeriods);
def LowestLow6 = lowest(LOW, trendPeriods);
def trend6 = if ((Close - LowestLow) / (HighestHigh - LowestLow)) > .5
then 1
else 0;

AssignPriceColor(if CandleTrend then color.green else color.red);

###End
 

Attachments

  • qEauH4J.png
    qEauH4J.png
    16 KB · Views: 507
Last edited by a moderator:
Several of you have used my AsGoodAsItGets indicator. This is a new version for the lower. It uses a Squared.Histogram to show Short/Long Entries. I use it above the Modified Laguerre_Momentum posted a few minutes ago (Remember this repaints)!

Here is the code:

# AsGoodAsItGets Lower Indicator
#CSR Buy/Sell Arrows with Short/Long Bubbles
#Developed 4-23-23 First Edition 8-23-22 Revised

declare lower;

input atrreversal = 2.0;

def priceh = MovingAverage(AverageType.EXPONENTIAL, high, 5);
def pricel = MovingAverage(AverageType.EXPONENTIAL, low, 5);

def EIL = ZigZagHighLow("price h" = priceh, "price l" = pricel, "percentage reversal" = .01, "absolute reversal" = .05, "atr length" = 5, "atr reversal" = atrreversal).lastL;
def EIH = ZigZagHighLow("price h" = priceh, "price l" = pricel, "percentage reversal" = .01, "absolute reversal" = .05, "atr length" = 5, "atr reversal" = atrreversal).lastH;

plot signaldown = !isNAN(EIH);
signaldown.SetPaintingStrategy(PaintingStrategy.SQUARED_HISTOGRAM);


plot signalrevBot = !isNaN(EIL);

Signalrevbot.SetPaintingStrategy(PaintingStrategy.SQUARED_HISTOGRAM);


input usealerts = yes;
alert(usealerts and signaldown[1] == 1, "Short", alert.bar, sound.ring);
alert(usealerts and signalrevbot[1] == 1, "Long", alert.bar, sound.ring);
 
I use a 1 minute and 5 minute charts for day trading. Open your "Added studies and strategies" (beaker on chart view to left of time drop down and wheel then beaker. Click on beaker. Your studies will drop down. Click on wheel to right of study and change np to 9 on Top/Bottoms Indicator.

Same process on TurningPointArrows and set length to 15.

You can set these parameters how you wish...these are the settings I use.
Can you share the link to the chart with these settings?
 
Now what we need is a backtest script for this strategy. I haven't learned how to create them yet but would love to be able to change the timeframes and tweak the settings to optimize them for the ever changing market conditions.
Change the setting and scroll back to see how your new settings played out and look historically?
 
Now what we need is a backtest script for this strategy. I haven't learned how to create them yet but would love to be able to change the timeframes and tweak the settings to optimize them for the ever changing market conditions.
Repainters have their place; especially when used as part of a chart setup like this one.

But backtesting of scripts is contra-indicated when there are repainting indicators like the zig-zag in this chart setup.
Given that repainters erase all the poor signals; the results of backtesting can be misleading.
Therefore, the posting of repainting backtesting scripts and their results are prohibited on this forum as they might give the members who don't read through all the posts a false impression.
 
Last edited:
Repainters have their place; especially when used as part of a chart setup like this one.

But backtesting of scripts is contra-indicated when there are repainting indicators like the zig-zag in this chart setup.
Given that repainters erase all the poor signals; the results of backtesting can be misleading.
Therefore, the posting of repainting backtesting scripts and their results are prohibited on this forum as they might give the members who don't read through all the posts a false impression.
Thanks for your reply
 
Last edited by a moderator:
I'm sorry- I set my TopsBottoms on 9 and my TurningPointArrows on 15
Do you have to change the codes to set the above? What do you mean by "9" and "15"? What time frames are the two indicators you posted most useful? Thanks. Looks interesting.

Thanks for the indicators. For some reason, I only get the arrows and the long/short labels are missing. I wonder if anyone else experienced this.
They don't show up often but does show up on 5 or 3 or 1 minute depending on a stock.

I have other things on my chart. Here are the indicator links with the listed settings:

As_Good_HighLow_TurningPointArrows: http://tos.mx/F8IJQQU
AsGood_TopsBottoms: http://tos.mx/SXySOwS
Thanks. How have these two indicators been working out on 1 and 5 minutes? How about on other higher time frames?

Does AsGoodCandleTrendColor indicator need to be set at 9 trend length or at the default trend length of 6?

Having used ASAIG indicators on futures trading for one or two hours, I can definitely report that the past arrows that appear on one's chart are misleading in that many or most of them are repainted arrows. However, I do believe ASAIG indicators are useful if you can confirm these arrow, pivots or label signals with some other indicators. To clarify, I believe AGAIG indicators are best used as a scout or advance warning signal that could turn out to be right or wrong.
 
Last edited by a moderator:
@csricksdds : Thank you for sharing the indicator, I have few questions.

1. I see the short and long label keep changing from candle to candle. Is that known behaviour?
2. What time frame would you recommend?
3. Any particular stock/future you use this for?
4. What is a good entry/exit?
 
Having used ASAIG indicators on futures trading for one or two hours, I can definitely report that the past arrows that appear on one's chart are misleading in that many or most of them are repainted arrows. However, I do believe ASAIG indicators are useful if you can confirm these arrow, pivots or label signals with some other indicators. To clarify, I believe AGAIG indicators are best used as a scout or advance warning signal that could turn out to be right or wrong.
Thanks for your comments. As stated in previous posts my trading is geared towards the SPY (occasionally the QQQ's) and my indicators have been put together, and/or modified, to help increase the probability for success trading those two ETFs. For years I traded the market at large but find the SPY more profitable with less stress on a daily basis. I'm well aware of the repainting issue and only share these indicators in the hope they can be of benefit and/or help raise the probability for success with anyone else.

We moved to The Villages, FL nine years ago (large retirement community) and have found that a Senior Citizen with their left turn signal indicator on has very little to do with whether they actually turn left or not? The probabilities get better if they also slow down and move towards the left lane although I have seen right turns from there as well.

My AGAIG indicators have helped me raise the probability for personal success. When two or three give the same trend change indication is where my trades are placed, or exited. If the market decides something different than indicated I immediately exit the trade. It has been my experience that my AGAIG indicators are much more accurate than what I personally think the market might do!

Since the SPY now has daily expirations my preference is trading the ORB, and trends, until about noon. Past experience tells me that It's easy to make money in the morning and give it all back in the afternoon.

Suggestions on how to improve, or set better parameters, on my AGAIG indicators is always appreciated.
Hi @csricksdds
For some reason the long code for the HighLoPivotPoints does not work when I paste it in my ToS. Do you have share chart link with the indicators that you use? Thanks
 

Join useThinkScript to post your question to a community of 21,000+ developers and traders.

Not the exact question you're looking for?

Start a new thread and receive assistance from our community.

87k+ Posts
479 Online
Create Post

The Market Trading Game Changer

Join 2,500+ subscribers inside the useThinkScript VIP Membership Club
  • Exclusive indicators
  • Proven strategies & setups
  • Private Discord community
  • ‘Buy The Dip’ signal alerts
  • Exclusive members-only content
  • Add-ons and resources
  • 1 full year of unlimited support

Frequently Asked Questions

What is useThinkScript?

useThinkScript is the #1 community of stock market investors using indicators and other tools to power their trading strategies. Traders of all skill levels use our forums to learn about scripting and indicators, help each other, and discover new ways to gain an edge in the markets.

How do I get started?

We get it. Our forum can be intimidating, if not overwhelming. With thousands of topics, tens of thousands of posts, our community has created an incredibly deep knowledge base for stock traders. No one can ever exhaust every resource provided on our site.

If you are new, or just looking for guidance, here are some helpful links to get you started.

What are the benefits of VIP Membership?
VIP members get exclusive access to these proven and tested premium indicators: Buy the Dip, Advanced Market Moves 2.0, Take Profit, and Volatility Trading Range. In addition, VIP members get access to over 50 VIP-only custom indicators, add-ons, and strategies, private VIP-only forums, private Discord channel to discuss trades and strategies in real-time, customer support, trade alerts, and much more. Learn all about VIP membership here.
How can I access the premium indicators?
To access the premium indicators, which are plug and play ready, sign up for VIP membership here.
Back
Top