#mvp_ants_01_sqr_fibs
#https://usethinkscript.com/threads/add-range-lines-to-script.20319/
#Add Range Lines To Script
#halcyonguy said:
#here is my version of MVP
#https://usethinkscript.com/threads/ants-—-momentum-volume-and-price-mvp.7497/#post-74080
#-------------------------------
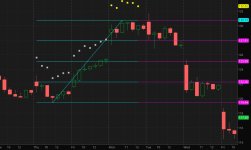
#here is my version of MVP
#it draws squares above the candles, depending on 3 conditions.
#momentum up is when close is > previous close, for the min bars, within a max series.
#volume up is determined when volume average(15) > (volume average(50) * 20%)
#price up is determined when price average(15) > (price average(50) * 6%). ( i changed it from 20% to 6%, because price rarely rose 20%, )
#can show a color legend to the right of last candle.
#a gray horizontal line is drawn when the momentum condition is true.
#test data,
#...can draw colored squares below the candles, for each condition.
#...can show price average lines
#...a separate study will show volume average lines
# — Momentum, Volume And Price ( MVP ) —
# The Ants indicator looks for the following:
# 1... Momentum - The stock is up at least 12 of the past 15 days.
# 2... Volume - The volume has increased over the past 15 days by 20% to 25%.
# 3... Price - The price is up at least 20% over the past 15 days.
# colored squares, above the candles:
# Gray - Momen requirement met.
# Blue - Momen and price requirement met.
# Yellow - Momen and vol requirement met.
# Green - Momen and vol and price requirement met.
#/////////////////////////////////////
def na = Double.NaN;
def bn = BarNumber();
# ======================================
input OOOOOO_Momentum_OOOOOOO = yes;
# MVP
# 1... Momentum - The stock is up at least 12 of the past 15 days.
# it tests if current bar close > previous close
input series_max = 15;
input series_min = 12;
def momen_max = series_max;
def momen_min = series_min;
#input momentum_qty = 15;
#input momentum_min = 12;
def chgup = close > close[1];
def squares_price_offset = 0.02;
def vert = squares_price_offset;
# min series , when there are 'min' quantity of bars or greater, within a 'qty' set of bars.
# ex. if there are 12 min bars, within 15 qty bars.
AddLabel(1, "MVP qtys " + momen_min + "/" + momen_max, Color.CYAN);
# --------------------------------
# nested fold.
# test if x min bars, or more, are true , out of y qty bars
# loop1 , start at current bar, loops to future bars.
# loop2 , on each bar of loop1, it looks back at 'momentum_qty' quantity of bars and counts the times chgup is true.
# when done, if the count is > momentum_min, then a 1 is passed on to loop1.
# if momupx > 0, then at least 1 valid series was found, to go across the bar.
# add this to remove errors on last few bars, when bar is within (min-1) bars to the last bar,
# while !isnan( getvalue(close, -loop1) )
def momupx = fold loop1 = 0 to momen_max
with one
while !IsNaN( GetValue(close, -loop1) )
do one + if (fold loop2 = 0 to momen_max
with two
do two + if GetValue(chgup , (-loop1 + loop2) ) then 1 else 0) >= momen_min then 1 else 0;
# was there at least 1 min series found ?
def momup = if momupx > 0 then 1 else 0;
# line under bars
#def offset1 = 0.999;
def offset1 = 1.0;
def htper = 0.2;
def cldht = Round( (htper / 100) * close, 1 );
def cldtop = if !momup[1] and momup then (low * offset1) else if momup then cldtop[1] else na;
def cldbot = cldtop - cldht;
# addcloud(cldtop, cldbot, color.cyan, color.cyan);
input series_horz_line = no;
plot sqr_horz = if series_horz_line then cldtop else na;
# chg ddd to sqr_horz
sqr_horz.SetLineWeight(2);
sqr_horz.SetDefaultColor(Color.LIGHT_GRAY);
#sqr_horz.SetDefaultColor(Color.yellow);
# true during a series of squares
def sqrs = if !isnan(cldtop) then 1 else 0;
# ======================================
# ======================================
input OOOOOO_Volume_OOOOOOO = yes;
# 2... Volume - The volume has increased over the past 15 days by 20% to 25%.
# the 15 day average daily volume is 20% or greater than the 50 day average.
input volume_increase_percent = 20.0;
def vip = volume_increase_percent / 100;
#input vol_qty = 15;
#input vol_min = 12;
#def vol_max = series_max;
#def vol_min = series_min;
input vol_avg_short_len = 15;
input vol_avg_long_len = 50;
def vol_avgshort = Average(volume, vol_avg_short_len);
def vol_avglong = Average(volume, vol_avg_long_len);
# compare vol15avg to (vol50avg * x%)
def volupx = if ( vol_avgshort > (vol_avglong * (1 + vip)) ) then 1 else 0;
def volup = volupx;
# ======================================
input OOOOOO_Price_OOOOOOO = yes;
# 3... Price - The price is up at least 20% over the past 15 days.
#input price_increase_percent = 20.0;
input price_increase_percent = 6.0;
def prp = price_increase_percent / 100;
#input pr_max = 15;
#input pr_min = 12;
def pr_max = series_max;
def pr_min = series_min;
input price_avg_short_len = 15;
input price_avg_long_len = 50;
def pr_avgshort = Average(close, price_avg_short_len);
def pr_avglong = Average(close, price_avg_long_len);
def prupx = if ( pr_avgshort > (pr_avglong * (1 + prp)) ) then 1 else 0;
def prup = prupx;
# //////////////////////////////////////
# //////////////////////////////////////
# draw squares, above candles, when a cond is true
# -- when candle is part of a min momen series
# colored squares, above the candles:
# Gray - Momen requirement met.
# Blue - Momen and price requirement met.
# Yellow - Momen and vol requirement met.
# Green - Momen and vol and price requirement met.
def mom = (momup and !volup and !prup);
def mompr = (momup and !volup and prup);
def momvol = (momup and volup and !prup);
def momvolpr = (momup and volup and prup);
#def sqr = (momup or volup or prup);
def sqr = (mom or mompr or momvol or momvolpr);
# //////////////////////////////////////
# plot a square above candles
plot t = if sqr then (high * (1 + (1 * vert))) else na;
t.DefineColor("cmom", Color.LIGHT_GRAY);
t.DefineColor("cmompr", Color.BLUE);
t.DefineColor("cmomvol", Color.YELLOW);
t.DefineColor("cmomvolpr", Color.GREEN);
t.DefineColor("cnon", Color.CURRENT);
t.AssignValueColor(
if momvolpr then t.Color("cmomvolpr")
else if momvol then t.Color("cmomvol")
else if mompr then t.Color("cmompr")
else if mom then t.Color("cmom")
else t.Color("cnon"));
t.SetPaintingStrategy(PaintingStrategy.SQUARES);
t.SetLineWeight(4);
# -------------------------------------
# legend
input show_color_legend = yes;
input legend_bar_offset = 4;
input legend_vert_percent = 97;
def v = (legend_vert_percent / 100) * (close[legend_bar_offset]);
def k = !IsNaN(close[legend_bar_offset]) and IsNaN(close[(legend_bar_offset - 1)]);
AddChartBubble(show_color_legend and k, v, "Gray - Momen", Color.LIGHT_GRAY, yes);
AddChartBubble(show_color_legend and k, v, "Blue - Momen, price", Color.BLUE, yes);
AddChartBubble(show_color_legend and k, v, "Yellow - Momen, vol", Color.YELLOW, yes);
AddChartBubble(show_color_legend and k, v, "Green - Momen, vol, price", Color.GREEN, yes);
# test data , show test squares below the candles
input test_momen_series_quantities = no;
# show counts of momen min series
plot mx = if test_momen_series_quantities then momupx else na;
mx.SetPaintingStrategy(PaintingStrategy.VALUES_BELOW);
mx.SetDefaultColor(Color.WHITE);
input test_momen_up_lower_gray = no;
plot my = if (test_momen_up_lower_gray and momup) then (low * (1 - (1 * vert))) else na;
my.SetDefaultColor(Color.LIGHT_GRAY);
my.SetPaintingStrategy(PaintingStrategy.SQUARES);
my.SetLineWeight(4);
input test_volume_up_lower_purple = no;
plot vy = if (test_volume_up_lower_purple and volup) then (low * (1 - (2 * vert))) else na;
vy.SetDefaultColor(Color.MAGENTA);
vy.SetPaintingStrategy(PaintingStrategy.SQUARES);
vy.SetLineWeight(4);
input test_price_up_lower_blue = no;
plot py = if (test_price_up_lower_blue and prup) then (low * (1 - (3 * vert))) else na;
py.SetDefaultColor(Color.BLUE);
py.SetPaintingStrategy(PaintingStrategy.SQUARES);
py.SetLineWeight(4);
input test_all_up = no;
plot all = if (test_all_up and momvolpr) then (low * (1 - (4 * vert))) else na;
all.SetDefaultColor(Color.GREEN);
all.SetPaintingStrategy(PaintingStrategy.SQUARES);
all.SetLineWeight(4);
input test_price_average_lines = no;
plot prs = if test_price_average_lines then pr_avgshort else na;
plot prl = if test_price_average_lines then pr_avglong else na;
prs.SetDefaultColor(Color.GREEN);
prl.SetDefaultColor(Color.MAGENTA);
#------------------------
#------------------------
# true during , horz line during squares , sqr_horz
#def sqrs = if !isnan(sqr_horz) then 1 else 0;
def sqr_first = (sqrs and !sqrs[1]);
def sqr_last = (sqrs and !sqrs[-1]);
def n = 200;
# find lowest , highest, during sqrs
# look for uptrends. low will be before high
def sqrhibn;
def sqrlobn;
def sqrhi;
def sqrlo;
def slope;
if bn == 1 then {
sqrhibn = 0;
sqrlobn = 0;
sqrhi = 0;
sqrlo = 0;
slope = 0;
} else if sqr_first then {
# 1st bar in sqr seq. run loops to find hi and lo
sqrhi = fold a = 0 to n
with b = high
while getvalue(sqrs, -a)
do max(b,getvalue(high,-a));
sqrlo = fold c = 0 to n
with d = low
while getvalue(sqrs, -c)
do min(d,getvalue(low,-c));
sqrhibn = bn + (fold e = 0 to n
with f
while (getvalue(high,-e) != sqrhi)
do f + 1);
sqrlobn = bn + (fold g = 0 to n
with h
while (getvalue(low,-g) != sqrlo)
do h + 1);
slope = (sqrhi - sqrlo)/(sqrhibn - sqrlobn);
} else if sqrs then {
sqrhibn = sqrhibn[1];
sqrlobn = sqrlobn[1];
sqrhi = sqrhi[1];
sqrlo = sqrlo[1];
slope = slope[1];
} else {
sqrhibn = 0;
sqrlobn = 0;
sqrhi = 0;
sqrlo = 0;
slope = 0;
}
input diag_level1_per = 25.0;
input diag_level2_per = 50.0;
input diag_level3_per = 75.0;
input diag_level4_per = 0.0;
def sqr_diag = if bn == sqrlobn then low
else if bn >= sqrlobn and bn <= sqrhibn then sqr_diag[1] + slope
else na;
input show_diag_line_and_levels = yes;
plot z1 = if show_diag_line_and_levels then sqr_diag else na;
z1.SetDefaultColor(Color.cyan);
def level0 = if bn == 1 or isnan(close) then na
else if sqr_first then sqrlo
else level0[1];
plot zl0 = if show_diag_line_and_levels then level0 else na;
zl0.AssignValueColor(if sqrs then color.cyan else color.magenta);
def level5 = if bn == 1 or isnan(close) then na
else if sqr_first then sqrhi
else level5[1];
plot zl5 = level5;
zl5.AssignValueColor(if sqrs then color.cyan else color.magenta);
def level1 = if bn == 1 or isnan(close) or diag_level1_per == 0 then na
else if sqr_first then (sqrlo + ((sqrhi-sqrlo)*(diag_level1_per/100)))
else level1[1];
plot zl1 = if show_diag_line_and_levels then level1 else na;
zl1.AssignValueColor(if sqrs then color.cyan else color.magenta);
def level2 = if bn == 1 or isnan(close) or diag_level1_per == 0 then na
else if sqr_first then (sqrlo + ((sqrhi-sqrlo)*(diag_level2_per/100)))
else level2[1];
plot zl2 = if show_diag_line_and_levels then level2 else na;
zl2.AssignValueColor(if sqrs then color.cyan else color.magenta);
def level3 = if bn == 1 or isnan(close) or diag_level1_per == 0 then na
else if sqr_first then (sqrlo + ((sqrhi-sqrlo)*(diag_level3_per/100)))
else level3[1];
plot zl3 = if show_diag_line_and_levels then level3 else na;
zl3.AssignValueColor(if sqrs then color.cyan else color.magenta);
def level4 = if bn == 1 or isnan(close) or diag_level1_per == 0 then na
else if sqr_first then (sqrlo + ((sqrhi-sqrlo)*(diag_level4_per/100)))
else level4[1];
plot zl4 = if show_diag_line_and_levels then level1 else na;
zl4.AssignValueColor(if sqrs then color.cyan else color.magenta);
addchartbubble(0 , low*0.995,
bn + "\n" +
sqrhibn + "\n" +
sqrlobn + "\n" +
sqrhi + "\n" +
sqrlo + "\n"
, (if sqr_first then color.yellow else color.gray), no);
#
#